. 2025 Jun 4;23(1):268.
doi: 10.1186/s12964-025-02266-0.

The immunosuppressive effect of glucocorticoids in human primary T cells is mainly mediated via a rapid inhibition of the IL-2/IL-2R signaling axis

Affiliations

The immunosuppressive effect of glucocorticoids in human primary T cells is mainly mediated via a rapid inhibition of the IL-2/IL-2R signaling axis

L Tatiana Albarracin Melo et al. Cell Commun Signal. .

Abstract

Background: Glucocorticoids (GCs) are highly effective anti-inflammatory drugs that suppress T-cell activation, cytokine production, and T-cell proliferation. Nevertheless, at which molecular level and how fast GCs exert their immunosuppressive effect in T cells still remains elusive, as inconsistent genomic and non-genomic mechanisms of action have been proposed. One model postulates that GCs quickly inhibit proximal T-cell receptor (TCR) signaling via a non-genomic mechanism, whereas others have shown a strong inhibition of interleukin-2 (IL-2) transcription at later stages of T-cell activation. Due to their therapeutic significance, we have decided to shed light onto this issue and investigated how fast and at which level GCs inhibit T-cell activation by analyzing TCR and IL-2 signaling.

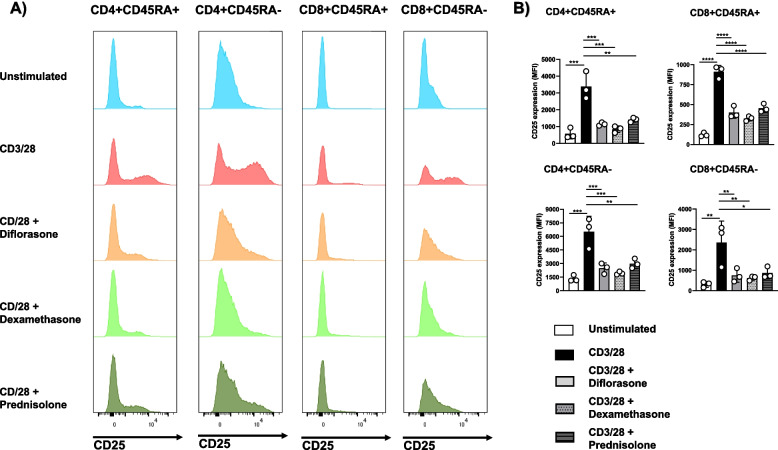
Methods: We utilized primary human T cells isolated from healthy donors, which were stimulated with immobilized CD3/CD28 antibodies. These cells were treated with three different GCs, diflorasone, dexamethasone, and prednisolone.

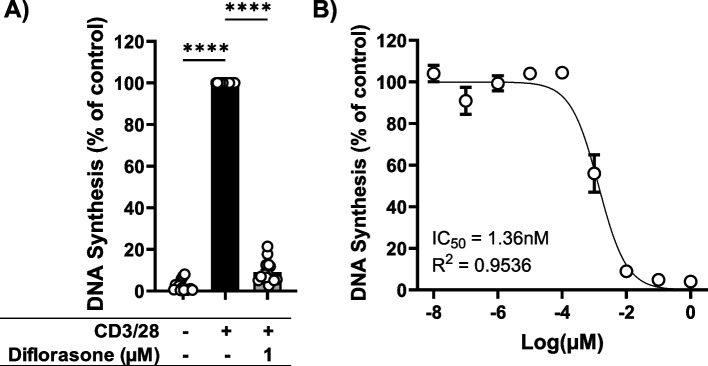
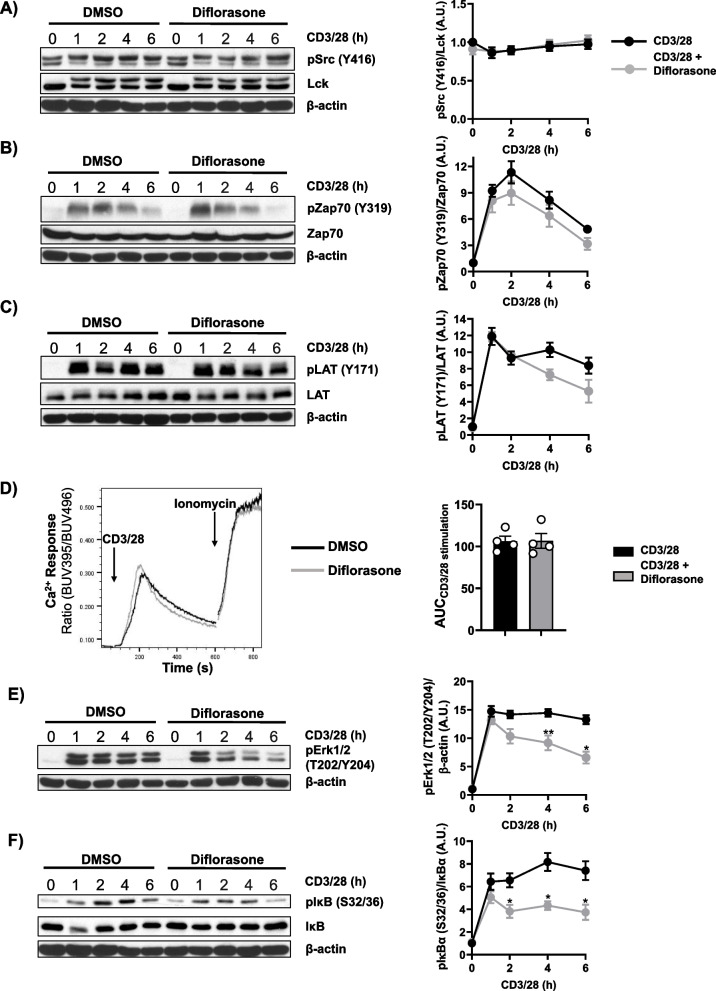
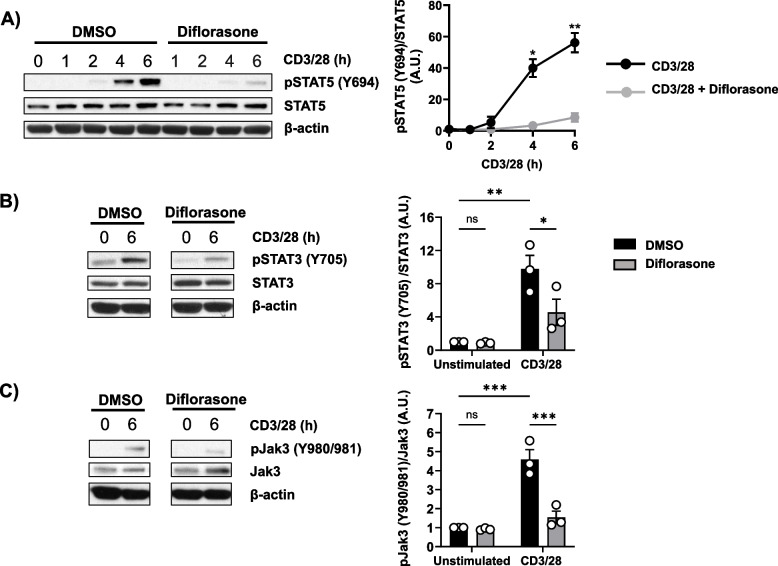
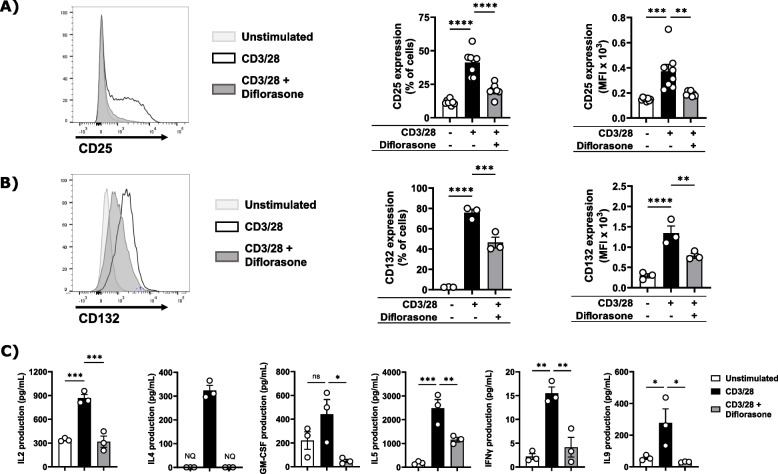
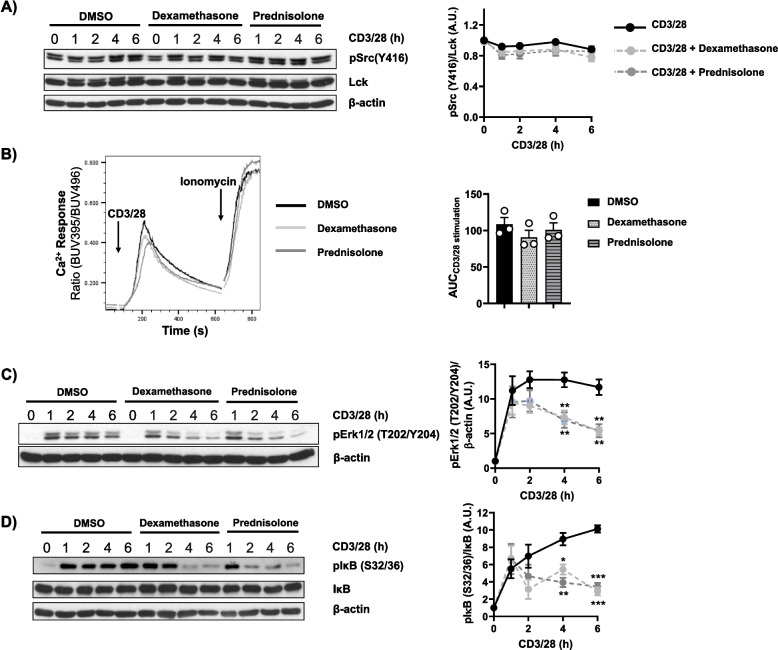
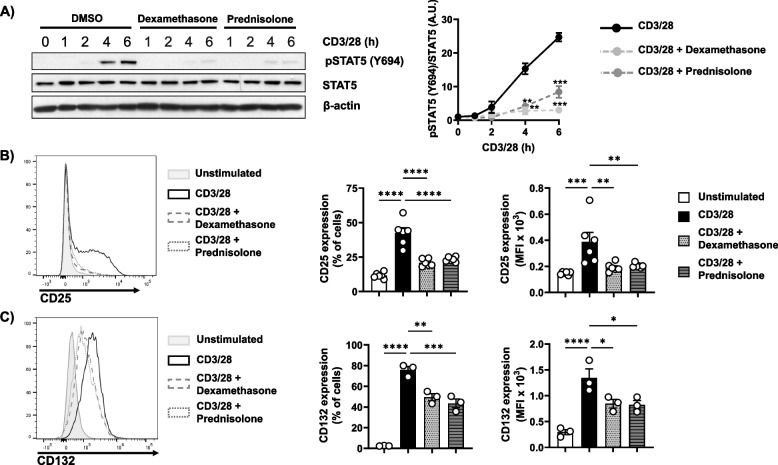
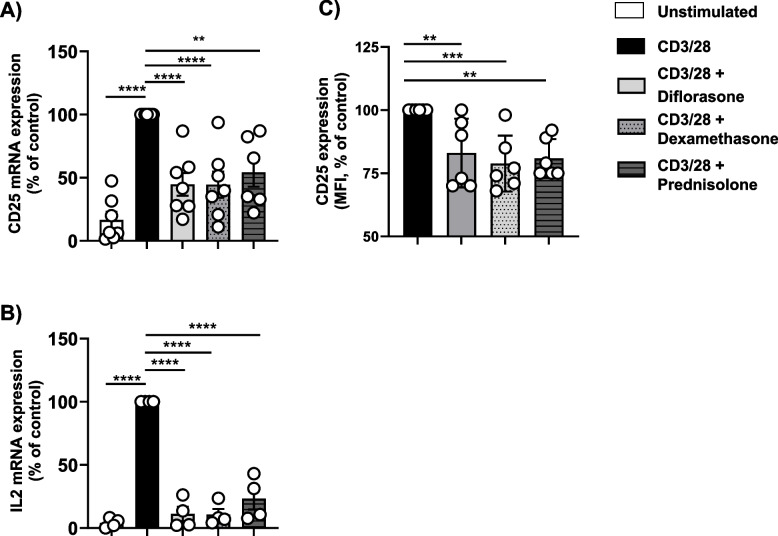
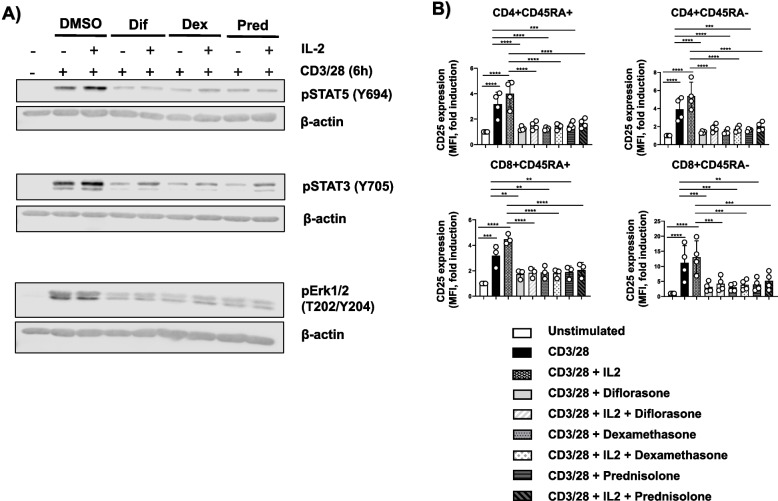
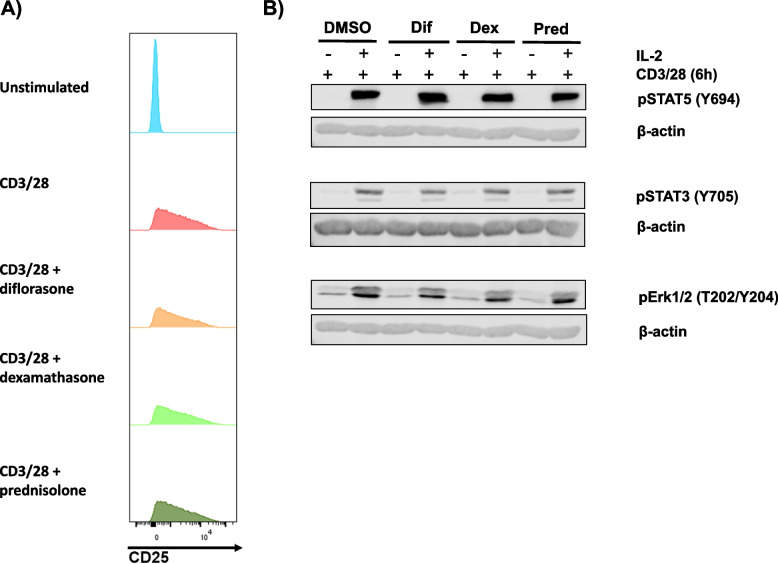
Results: Analyses of signaling kinetics revealed that GCs did not affect early TCR signaling as suggested by the normal phosphorylation levels of lymphocyte-specific protein tyrosine kinase (Lck), zeta-chain-associated protein kinase 70 (Zap70), linker for activation of T cells (LAT), and unchanged Ca2+ influx. Conversely, we found that GCs strongly and rapidly suppressed the activation of the Janus kinase (Jak)/ signal transducer and activator of transcription (STAT) pathway within 4-6 h upon CD3/CD28 stimulation in primary human T cells. This observation was in line with a strong inhibition of cytokine production and with the impaired upregulation of the IL-2 receptor (IL-2R) upon GC treatment, thus resulting in the abrogation of T-cell proliferation.

Conclusions: Our study, by showing that GCs rapidly suppress the IL-2/IL-2R expression and signaling without significantly affecting proximal TCR signaling, has highlighted a clear mechanism of action of GCs that contributes to their therapeutic efficacy.

Keywords: Erk1/2 activation; Glucocorticoids; IL-2 signaling; Immunosuppression; IκB activation; Jak/STAT pathway; T cells; TCR signaling.


Conflict of interest statement

Declarations. Ethics approval and consent to participate: The studies involving humans were approved by the Ethics Committee of Otto-von-Guericke University Magdeburg and the University Hospital of Magdeburg (Approval No. 175/18). The studies were conducted in accordance with the local legislation and institutional requirements. The participants provided their written informed consent to participate in this study. Consent for publication: Not applicable. Competing interests: The authors declare no competing interests.

Figures

Fig. 1
Fig. 1
Diflorasone inhibits T-cell proliferation. Freshly isolated peripheral blood T cells were left either untreated or stimulated with CD3/CD28 antibodies. A T-cell proliferation was determined by [3H]-TdR incorporation assay in the presence or absence of diflorasone. Data are presented as the mean ± SEM of 15 independent experiments (15 donors). Statistical analysis was performed with one-way ANOVA followed by Dunnett’s post hoc test (**** p ≤ 0.0001). B The drug-response curve was determined by [3H]-TdR incorporation assay using a concentration range of diflorasone from 1 to 1 × 10–8 µM. Data are presented as the mean ± SEM of 4 independent experiments (4 donors). The IC50 value was obtained by nonlinear regression analysis using GraphPad Prism 10
Fig. 2
Fig. 2
Diflorasone treatment does not affect TCR signaling but inhibits sustained Erk1/2 and IκB phosphorylation in CD3/CD28-activated human T cells. Freshly isolated peripheral blood T cells were pretreated with 1µM diflorasone for 2 h and subsequently stimulated with CD3/28-coated beads for the indicated time points. The phosphorylation levels and the expression of Lck (A), Zap70 (B), LAT (C), Erk1/2 (E), and IκB (F) were assessed in cell lysates using phosphospecific, total protein or β-actin antibodies. For the detection of Lck phosphorylation, we used the phospho-Src antibody recognizing the highly conserved across Src-family kinases Y416. β-actin was used as a loading control. One representative immunoblot is presented on the left side of the figure (n = 4–6 donors). Bands in (A), (B), (C), (E), and (F) were quantified by normalizing the signal of the phosphorylated molecule to the signal of the corresponding total protein or β-actin and quantification analyses are presented in the graphs shown on the right side. Statistical analyses were performed using two-way ANOVA followed by Šídák´s post hoc test (*p ≤ 0.05 and **p ≤ 0.01). D Ca2+ influx was evaluated by flow cytometry upon CD3/28 stimulation of human T cells, which were pre-treated with diflorasone for 2 h. Ionomycin was employed to demonstrate equal loading with indo-1. A representative experiment is shown on the left side (n = 4 donors). The bar graph on the right side shows the quantification of the Area Under the Curve (AUC) of the CD3/28-stimulate samples
Fig. 3
Fig. 3
Impaired cytokine signalling in diflorasone-treated human T cells. Freshly isolated peripheral blood T cells were pretreated with 1µM diflorasone for 2 h and subsequently stimulated with CD3/28-coated beads. The phosphorylation levels and the expression of STAT5 (A), STAT3 (B), and Jak3 (C) were assessed in cell lysates using phospho-specific and total protein antibodies. β-actin was used as a loading control. A representative immunoblot is shown on the left side (4 donors were assayed in A and 3 donors in B and C). Bands in (A), (B), and (C) were quantified using ImageJ software by normalizing the signal of the phosphorylated molecule to the signal of the total target protein. Graphs on the right side show the phosphorylation levels of the indicated molecules as arbitrary units ± SEM of 3–4 experiments (1 donor was used in each experiment). Statistical analyses were performed using two-way ANOVA followed by Dunnett’s (STAT5) or Šídák’s (STAT3 and Jak3) post hoc test (*p ≤ 0.05, **p ≤ 0.01, and ***p ≤ 0.001)
Fig. 4
Fig. 4
Diflorasone suppresses the upregulation of cytokine receptors and cytokine production in activated T cells. Diflorasone-treated human T cells were activated with CD3/28 antibodies for 24 h and the expression levels of CD25 (A) and CD132 (B) were assessed by flow cytometry. A representative histogram is shown on the left side. Graphs on the right side depict analyses of the expression of CD25 and CD132 presented as percentages of positive cells or as mean fluorescence intensity (MFI) ± SEM from 3–8 independent experiments (1 donor was used in each experiment). C Diflorasone-treated human T cells were activated with CD3/28 antibodies for 6 h. Subsequently, supernatants were collected and the production of IL2, GM-CSF, IL4, IL9, IL5, and IFNγ was measured. Data represent the concentration of cytokines expressed as pg/ml ± SEM from 3 independent experiments (1 donor was used in each experiment). Significance was determined using one-way ANOVA followed by Dunnett’s post hoc test (****p < 0.0001, ***p < 0.001, **p < 0.01, and *p < 0.05, ns = not statistically significant, NQ = not detectable)
Fig. 5
Fig. 5
Dexamethasone and prednisolone do not inhibit Lck function and TCR-mediated signalling but inhibits sustained Erk1/2 and IκB phosphorylation in CD3/CD28-activated human T cells. Freshly isolated T cells were treated with 1µM dexamethasone or prednisolone and subsequently stimulated with CD3/28-coated beads for the indicated time points. Phosphorylation levels of Lck on Y394 (which were detected using the phospho-Src antibody recognizing the highly conserved across Src-family kinases Y416) and Lck expression (A), phosphorylation of Erk1/2 (T202/Y204) (C), phosphorylation of IκB (S32/36) and IκB expression (D) were assessed by immunoblotting. β-actin was used as a loading control. A representative immunoblot is presented on the left side (n = 4–6 donors). Quantification of the immunoblots was performed using the ImageJ software by normalizing the signal of the phosphorylated molecule to the signal of the total target protein or β-actin. Graphs on the right side show the phosphorylation levels of the indicated molecules as arbitrary units ± SEM from 4–6 experiments (1 donor was used in each experiment). Statistical analyses were performed using two-way ANOVA followed by Šídák’s post hoc test (*p ≤ 0.05 and **p ≤ 0.01, *** p ≤ 0.001, and **** p ≤ 0.0001). B Ca2+ influx was evaluated by flow cytometry upon CD3/28 stimulation of human T cells treated with dexamethasone and prednisolone. Ionomycin was employed to demonstrate equal loading with Indo-1. A representative experiment is displayed (n = 3 donors). Quantification of the Area Under the Curve (AUC) upon CD3/28 stimulation area is presented on the right side
Fig. 6
Fig. 6
Dexamethasone and prednisolone suppress STAT5 phosphorylation and the upregulation of CD25 and CD132 in activated T cells. Freshly isolated T cells were treated with 1µM dexamethasone or prednisolone and subsequently stimulated with CD3/28-coated beads for the indicated time points. A Phosphorylation levels of STAT5 (Y694) or STAT5 expression were assessed in cell lysates by immunoblotting, with β-actin serving as a loading control. A representative immunoblot is presented on the left side of the figure (n = 4 donors). Graphs on the right side show the phosphorylation levels of STAT5 as arbitrary units ± SEM from 4 experiments (1 donor was used in each experiment). Band quantification was performed using ImageJ software and values from phosphorylated STAT5 were normalized to the signal of STAT5. Statistical analyses were performed using two-way ANOVA followed by Dunnett’s post hoc test (*p ≤ 0.05, **p ≤ 0.01, and ****p ≤ 0.0001). B-C The expressions of CD25 and CD132 were analyzed 24 h after stimulation by flow cytometry. Representative histograms are shown on the left side. Graphs on the right side depict quantification analyses of the expression of CD25 and CD132 presented as percentages of positive cells or as mean fluorescent intensity (MFI) ± SEM from 3 independent experiments (1 donor was used in each experiment). p-values were calculated using one-way ANOVA followed by Dunnett’s post hoc test (**p < 0.01, ***p < 0.001 and ****p < 0.0001 versus CD3/28 control)
Fig. 7
Fig. 7
Treatment with GCs inhibits CD25 upregulation on different T-cell subsets. Freshly isolated T cells were treated with 1 µM diflorasone, dexamethasone, or prednisolone for 2 h and subsequently stimulated with CD3/28-coated beads for 24 h. After activation, T cells were stained with CD4, CD8, CD25, and CD45RA antibodies and analyzed by flow cytometry. A The levels of CD25 were assessed upon gaiting on different T-cell subsets as indicated in the histograms. Data from one representative donor are shown. B Graphs on the right side depict quantification analyses from 3 donors tested in 3 independent experiments. p-values were calculated using two-way ANOVA followed by Dunnett’s post hoc test (*p < 0.05, **p < 0.01, ***p < 0.001, and ****p < 0.0001 versus CD3/28 control)
Fig. 8
Fig. 8
Treatment with GCs inhibits CD25 expression. Freshly isolated T cells were treated with 1 µM diflorasone, dexamethasone, or prednisolone for 2 h and subsequently stimulated with CD3/28-coated beads for 6 h. The levels of CD25 mRNA (A) and IL-2 (B) were assessed by RT-PCR. The graphs shows CD25 or IL-2 expression from four different donors represented as percentages ± SEM compared to the CD3/CD28-stimulated sample not treated with GCs. Each dot in (A) and (B) represent a donor. 1 or 2 donors were included in each experiment. (C) the graph depicts analysis of CD25 expression by flow cytometry on CD3/CD28-stimulated T cells which were left untreated or treated with GCs. Data are presented as MFI normalized to untreated cells ± SEM from 3 independent experiments (2 donors were included in each experiment). p-values were calculated using two-way ANOVA followed by Dunnett’s post hoc test (**p < 0.01, ***p < 0.001, and ****p < 0.0001 versus CD3/28 control)
Fig. 9
Fig. 9
Exogenous IL-2 does not rescue Jak/STAT signaling and CD25 expression. Freshly isolated T cells were treated for 2 h with 1 µM diflorasone, dexamethasone, or prednisolone, followed by 6-h stimulation with CD3/CD28-coated beads in the presence or absence of recombinant IL-2. A Phosphorylation levels of STAT5 (Y694), STAT3 (Y705), and Erk1/2 (T202/Y204) were measured in cell lysates by immunoblotting, with β-actin used as a loading control. A representative immunoblot is shown, with data from 3 donors across 3 independent experiments. B The graphs display CD25 expression in various T-cell subsets (CD4, CD8, and CD45RA) after staining. Data from 3–4 donors in 3–4 independent experiments are shown as individual points (1 donor was used in each experiment). p-values were calculated using two-way ANOVA followed by Dunnett’s post hoc test (**p < 0.01, ***p < 0.001, and ****p < 0.0001)
Fig. 10
Fig. 10
Jak/STAT signaling is not affected in T-cell blasts treated with GCs. PBMCs were stimulated for 48 h with CD3/CD28 antibodies immobilized on cell culture dishes. After activation, cells were rested for 24 h and subsequently incubated with GCs (1 µM each) for 2 h. A CD25 expression was measured by flow cytometry after GC-treatment. Data from one representative donor are shown. B T-cell blasts were stimulated with recombinant IL-2 for 20 min and phosphorylation levels of STAT5 (Y694), STAT3 (Y705), and Erk1/2 (T202/Y204) were measured in cell lysates by immunoblotting, with β-actin used as a loading control. Data from one representative donor are shown. 1 donor in each independent experiments was tested (n = 3 experiments)

Similar articles

References

    1. Alexander SP, Cidlowski JA, Kelly E, Marrion NV, Peters JA, Faccenda E, et al. The Concise Guide to Pharmacology 2017/18: Nuclear hormone receptors. Br J Pharmacol. 2017;174 Suppl 1(Suppl Suppl 1):S208–24. - PMC - PubMed
    1. Cain DW, Cidlowski JA. Immune regulation by glucocorticoids. Nat Rev Immunol. 2017;17(4):233–47. - PMC - PubMed
    1. Rhen T, Cidlowski JA. Antiinflammatory action of glucocorticoids–new mechanisms for old drugs. N Engl J Med. 2005;353(16):1711–23. - PubMed
    1. Reichardt SD, Amouret A, Muzzi C, Vettorazzi S, Tuckermann JP, Luhder F, et al. The Role of Glucocorticoids in Inflammatory Diseases. Cells. 2021;10(11):2921. - PMC - PubMed
    1. Taves MD, Ashwell JD. Glucocorticoids in T cell development, differentiation and function. Nat Rev Immunol. 2021;21(4):233–43. - PubMed

MeSH terms