. 2025 Jun 4;13(1):124.
doi: 10.1186/s40478-025-02020-0.

Inflammation alters myeloid cell and oligodendroglial iron-handling in multiple sclerosis

Affiliations

Inflammation alters myeloid cell and oligodendroglial iron-handling in multiple sclerosis

Christian J Riedl et al. Acta Neuropathol Commun. .

Abstract

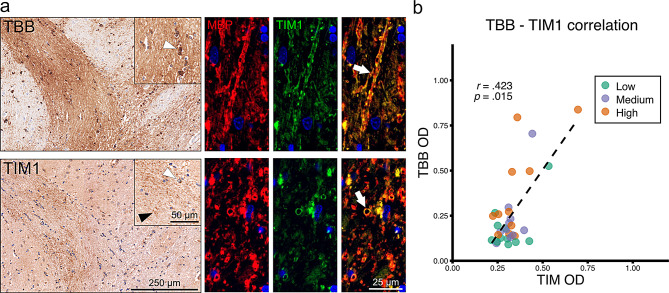
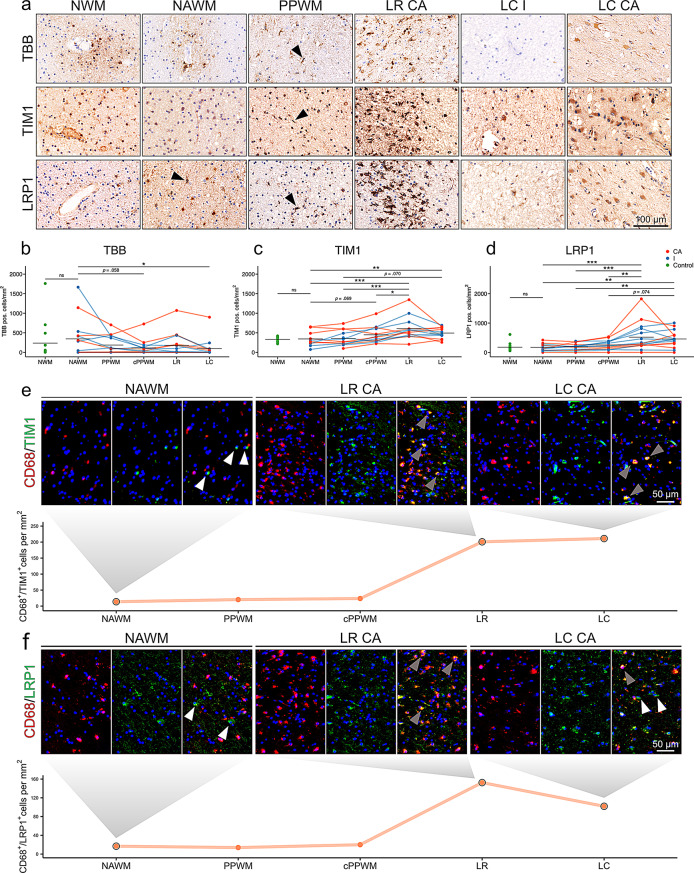
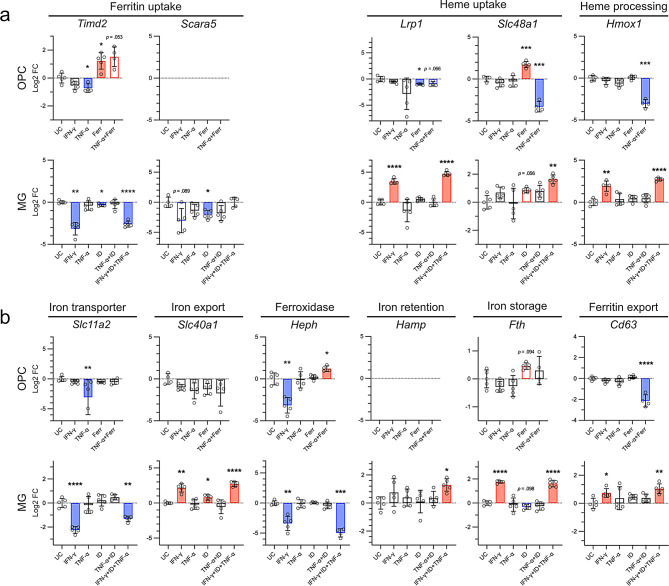
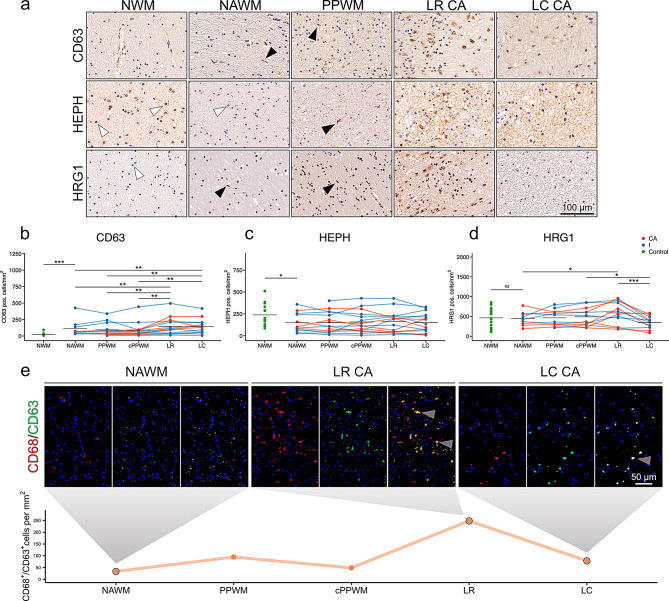
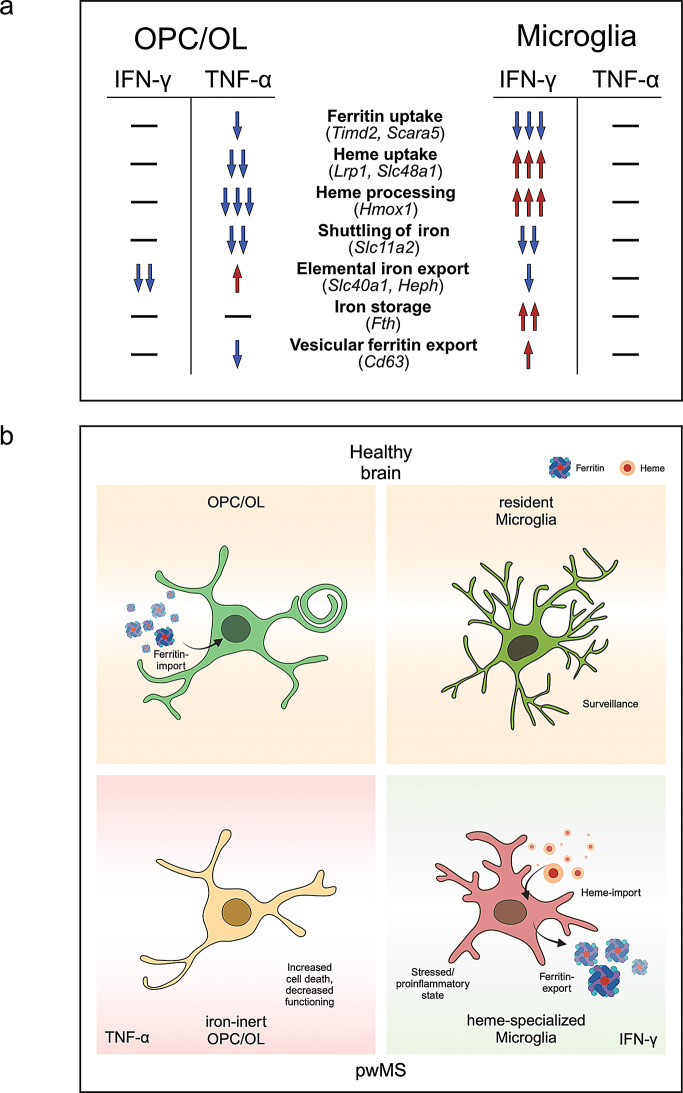
Changes in brain iron levels are a consistent feature of multiple sclerosis (MS) over its disease course. They encompass iron loss in oligodendrocytes in myelinated brain regions and iron accumulation in myeloid cells at so-called paramagnetic rims of chronic active lesions. Here, we explore the mechanisms behind this overall shift of iron from oligodendrocytes (OLs) to myeloid cells (MCs) and the loss of total brain-iron in MS. We investigated the expression of various iron importers and exporters, applying immunohistochemistry to a sample of control and MS autopsy cases. Additionally, we studied the transcriptional response of iron-related genes in primary rodent OL progenitor cells (OPCs) and microglia (MG) to various combinations of known MS-relevant pro-inflammatory stimuli together with iron loading. Histologically, we identified a correlation of OL-iron accumulation and the expression of the ferritin receptor TIM1 in myelinated white matter and observed an increase in the expression of iron-related proteins in myeloid cells at the lesion rims of MS plaques. qPCR revealed a marked increase of the heme scavenging and degradation machinery of MG under IFN-γ exposure, while OPCs changed to a more iron-inert phenotype with apparent decreased iron handling capabilities under MS-like inflammatory stimulation. Collectively, our data suggest that OL iron loss in MS is mainly due to a decrease in ferritin iron import. Iron accumulation in MCs at rims of chronic active lesions is in part driven by up-regulation of heme import and metabolism, while these cells also actively export ferritin.

Keywords: Iron loss; Iron rim lesions; Microglia; Multiple sclerosis; Oligodendrocytes.


Conflict of interest statement

Declarations. Ethical approval: All studies on post-mortem human samples were performed in accordance with the Ethics Committee of the Medical University of Vienna (EC-vote: 1067/2024 and 1636/2019). Studies on primary rodent cell cultures were performed in accordance with the 2010/63/EU directive. As all procedures were performed post-sacrifice, no review board approval was needed. Animals were primarily sacrificed for diagnostics assays. Competing interests: The authors declare no competing interests.

Figures

Fig. 1
Fig. 1
Exploration of iron and TIM1 staining patterns (a) TBB and TIM1 staining on pencil fibers in putamen. Co-labeling of MBP and TIM1 revealed colocalization in this area. White arrowheads indicate positive cells. Black arrowheads indicate granular TIM1 positivity. White arrows indicate double positive myelin sheaths. (b) TBB and TIM1 optical densitometry (OD) of one region of interest per control tissue block each with low, medium, and high iron density correlated (Spearman’s correlation, r =.423, p =.015).
Fig. 2
Fig. 2
Iron, TIM1 and LRP1 in the supratentorial WM of pwMS. (a) Image panel of TBB, TIM1 and LRP1 on the normal white matter (NWM) of controls, the normal-appearing white matter (NAWM), periplaque white matter (PPWM), the lesion rim (LR) of chronic active (CA) lesions, and the lesion center (LC) of inactive (I) and chronic acitive (CA) lesions. Arrowheads indicate cells with a typical ramified MG morphology. Quantification of (b) TBB+, (c) TIM1+, and (d) LRP1+ positive cells overall. Black lines indicate means. NWM and NAWM were compared using Welch’s t-test for unequal variances. For comparison of NAWM, distant PPWM, close PPWM (cPPWM), LR and LC a mixed effects model with case as a random intercept effect was chosen (positive cells/mm2 ~ location*type (CA, I) + (1|case)). Significant p-values are indicated with asterisks: *≤ 0.05, ** ≤0.01, *** ≤0.001. (e) and (f) double-labeling of TIM1 and LRP1 with the phagocytosis marker CD68 on a tissue block of a CA lesion. White arrowheads indicate single positive cells for TIM1 and LRP1, grey arrowheads indicate double positive cells. The plots show quantification of one CA lesion.
Fig. 3
Fig. 3
qPCR results of primary rodent OPCs and MG. Cells were isolated using shaking of mixed glial cell cultures. MG and OPCs were stimulated for 24 h. Data were analysed using the Δ ΔCT method. Data were plotted as log2 fold changes. In cases of low expression levels (OPC/Scara5 and OPC/Hamp), no data points were plotted. Bars indicate the mean, whiskers indicate the standard deviation. Statistical testing was performed using Welch’s ANOVA for unequal variances, multiple comparisons were corrected using Dunnett’s T3. Significant p-values are indicated with asterisks: *≤ 0.05, ** ≤0.01, *** ≤0.001.
Fig. 4
Fig. 4
Validation of qPCR targets found in cell culture experiments. (a) CD63, HEPH and HRG1 stainings on a control and in MS cases. Black arrowheadsindicate rod shaped microglia. White arrowheads indicate oligodendrocytes. Quantification of (b) CD63+, (c) HEPH+, and (d) HRG1+ positive cells. Black lines indicate means. Normal white matter (NWM) and normal-appearing white matter (NAWM) of the CD63 staining were compared using Wilcoxon Rank Sum test. NWM and NAWM of HEPH and HRG1 were compared using Welch’s t-test for unequal variances. For comparsion of NAWM, distant periplaque white matter (PPWM), close PPWM (cPPWM), lesion rim (LR) and lesion center (LC) a mixed effects model was chosen with case as a random intercept effect (positive cells/mm2 ~ location*type (CA, I) + (1|case)). Significant p-values are indicated with asterisks: *≤ 0.05, ** ≤0.01, *** ≤0.001. (e) Double-labeling of CD63 and CD68 on a CA lesion. Grey arrowheads indicate double positive cells. The plot shows quantification of one CA lesion.
Fig. 5
Fig. 5
Graphical summary of RNA expression data. (a) Representation of the alterations of iron-handling mechanisms in oligodendrocytes (OL) and OL progenitor cells (OPC) under inflammatory conditions as suggested by qPCR data. (b) Implicated phenotypical alterations in OPC/OL and microglia (MG) in the brains of people with MS. Created in BioRender.com. https://BioRender.com

Similar articles

References

    1. Kuhlmann T et al (2023) Multiple sclerosis progression: time for a new mechanism-driven framework. Lancet Neurol 22(1):78–88 - PMC - PubMed
    1. Calabrese M et al (2024) Determinants and biomarkers of progression independent of relapses in multiple sclerosis. Annals of Neurology - PubMed
    1. Hametner S et al (2013) Iron and neurodegeneration in the multiple sclerosis brain. Ann Neurol 74(6):848–861 - PMC - PubMed
    1. Rahmanzadeh R et al (2022) A new advanced MRI biomarker for remyelinated lesions in multiple sclerosis. Ann Neurol 92(3):486–502 - PMC - PubMed
    1. Schweser F et al (2021) Decreasing brain iron in multiple sclerosis: the difference between concentration and content in iron MRI. Hum Brain Mapp 42(5):1463–1474 - PMC - PubMed

Publication types

MeSH terms

LinkOut - more resources