

Subgrouping autism and ADHD based on structural MRI population modelling centiles
- PMID: 40468437
- PMCID: PMC12135403
- DOI: 10.1186/s13229-025-00667-z
Subgrouping autism and ADHD based on structural MRI population modelling centiles
Abstract
Background: Autism and attention deficit hyperactivity disorder (ADHD) are two highly heterogeneous neurodevelopmental conditions with variable underlying neurobiology. Imaging studies have yielded varied results, and it is now clear that there is unlikely to be one characteristic neuroanatomical profile of either condition. Parsing this heterogeneity could allow us to identify more homogeneous subgroups, either within or across conditions, which may be more clinically informative. This has been a pivotal goal for neurodevelopmental research using both clinical and neuroanatomical features, though results thus far have again been inconsistent with regards to the number and characteristics of subgroups.
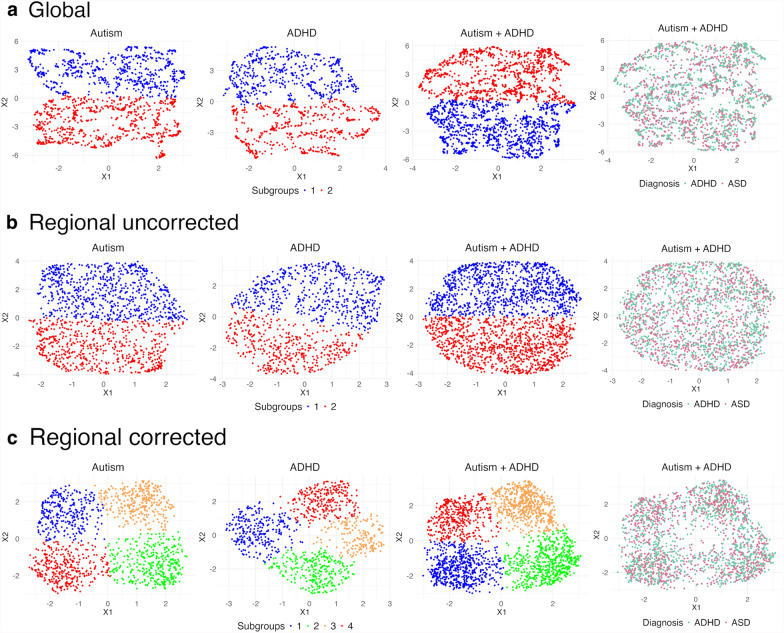
Methods: Here, we use population modelling to cluster a multi-site dataset based on global and regional centile scores of cortical thickness, surface area and grey matter volume. We use HYDRA, a novel semi-supervised machine learning algorithm which clusters based on differences to controls and compare its performance to a traditional clustering approach.
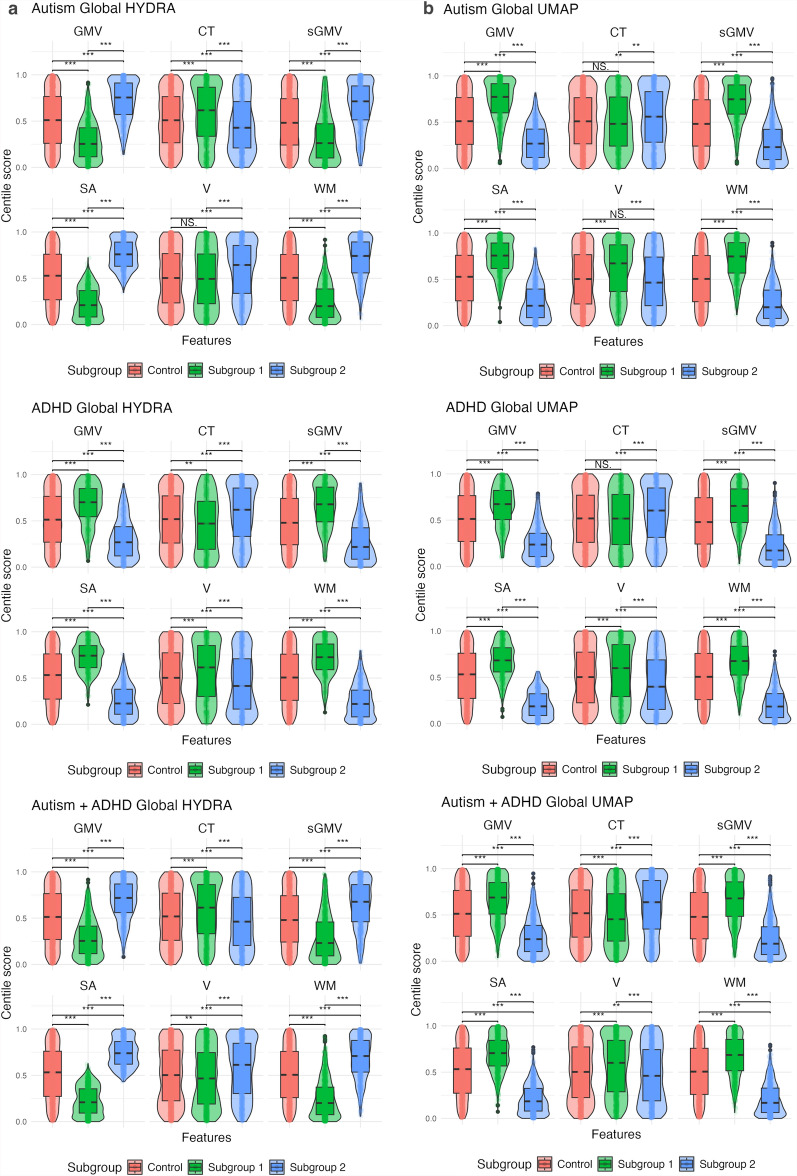
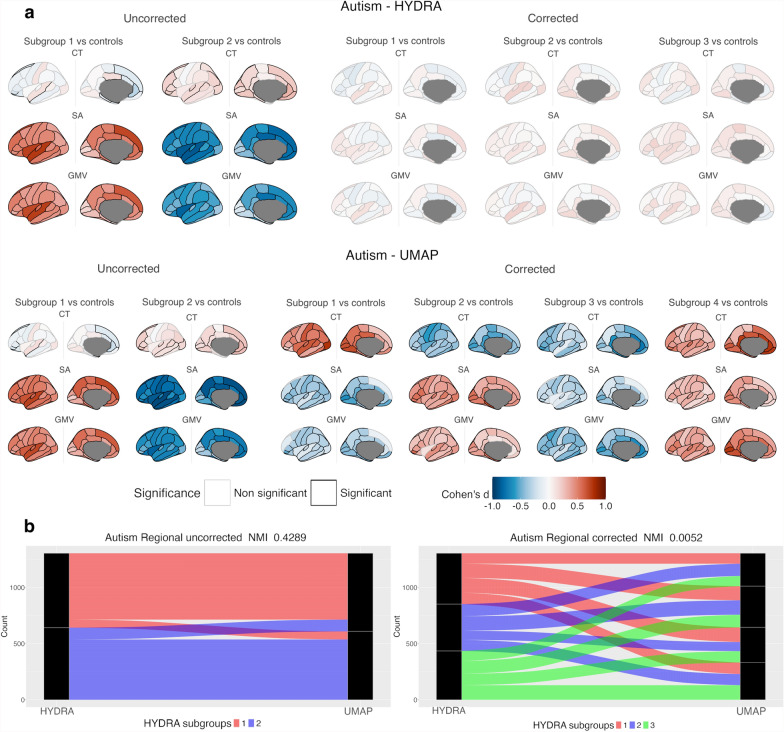
Results: We identified distinct subgroups within autism and ADHD, as well as across diagnosis, often with opposite neuroanatomical alterations relatively to controls. These subgroups were characterised by different combinations of increased or decreased patterns of morphometrics. We did not find significant clinical differences across subgroups.
Limitations: Crucially, however, the number of subgroups and their membership differed vastly depending on chosen features and the algorithm used, highlighting the impact and importance of careful method selection.
Conclusions: We highlight the importance of examining heterogeneity in autism and ADHD and demonstrate that population modelling is a useful tool to study subgrouping in autism and ADHD. We identified subgroups with distinct patterns of alterations relative to controls but note that these results rely heavily on the algorithm used and encourage detailed reporting of methods and features used in future studies.
Keywords: ADHD; Autism; Neuroimaging; Population modelling; Structural MRI; Subgrouping.
© 2025. The Author(s).
Conflict of interest statement
Declarations. Ethics approval and consent to participate: Ethical approval and informed consent were obtained for each primary study. The Cambridge Psychology Research Ethics Committee (PRE.2020.104) deemed that secondary analysis of deidentified data did not require ethical oversight. Consent for publication: Not applicable. Competing interests: RAIB, MVL, and M-CL are Associate Editors, and EA and BC are Editorial Board members of Molecular Autism. SBC is a former Editor-in-Chief of the journal. ETB reports consultancy work for Boehringer Ingelheim, Sosei Heptares, SR One, and GlaxoSmithKline. ETB, RAIB, JS, and AFA-B are cofounders of Centile Bioscience. PDA receives research support from Biohaven Pharmaceuticals. M-CL has received editorial honorarium from SAGE Publications. RN reported receiving grants from Brain Canada, Hoffman La Roche, Otsuka Pharmaceuticals, and Maplight Therapeutics outside the submitted work. EA reported receiving grants from Roche and Anavex; receiving nonfinancial support from AMO Pharma and CRA-Simons Foundation; and receiving personal fees from Roche, Impel, Ono, and Quadrant outside the submitted work.
Figures


References
-
- Courchesne E. Brain development in autism: Early overgrowth followed by premature arrest of growth. Ment Retard Dev Disabil Res Rev. 2004;10:106–11. - PubMed
MeSH terms
LinkOut - more resources
Full Text Sources
Medical
