. 2025 Jun 5;5(1):34.
doi: 10.1186/s43897-025-00153-3.

Smi-miRmTERF regulates organelle development, retrograde signaling, secondary metabolism and immunity via targeting a subset of SmmTERFs in Salvia miltiorrhiza

Affiliations

Smi-miRmTERF regulates organelle development, retrograde signaling, secondary metabolism and immunity via targeting a subset of SmmTERFs in Salvia miltiorrhiza

Xiaoxiao Qiu et al. Mol Hortic. .

Abstract

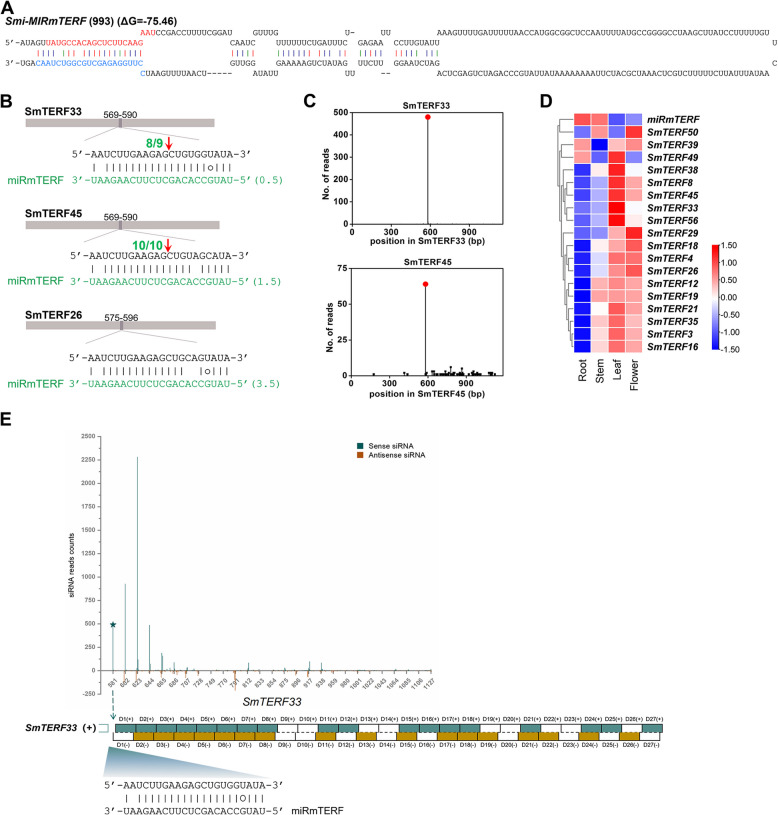
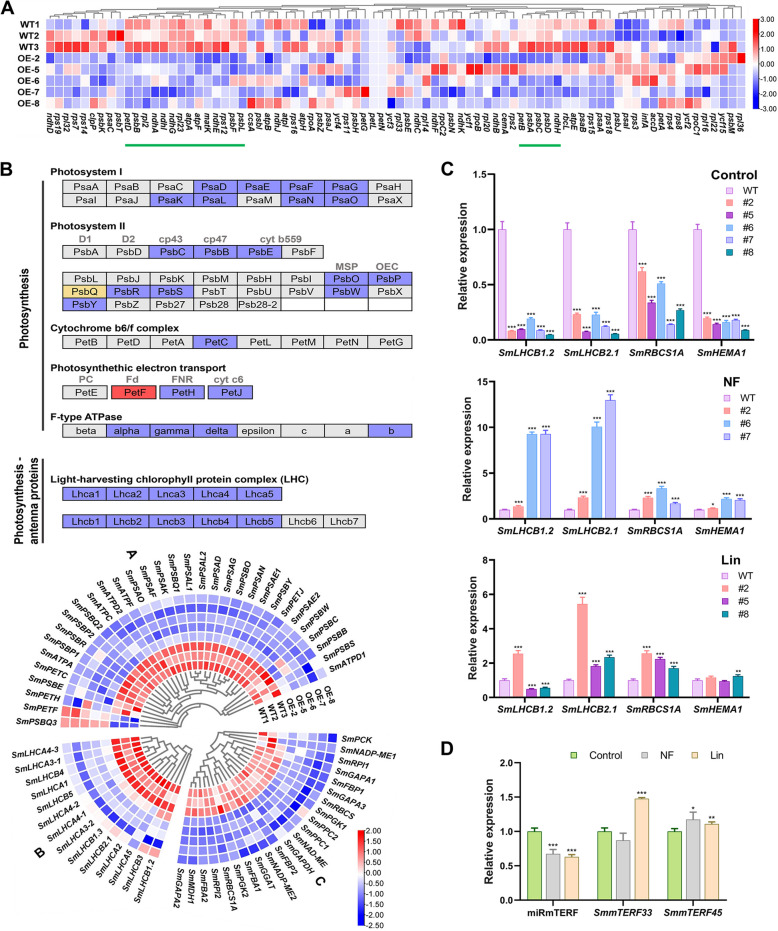
MicroRNAs are a class of endogenous small non-coding RNAs, some of which can trigger phased secondary small interfering RNA (phasiRNA) production from target genes. Mitochondrial transcription termination factors (mTERFs), mainly localized in chloroplasts and/or mitochondria, play critical roles in plant development and stress responses. We report here the identification of 63 mTERFs and a 22 nt novel miRNA (smi-miRmTERF), which directly cleave SmmTERF33 and SmmTERF45 transcripts to trigger phasiRNA biogenesis. The generated phasiRNAs could further trigger phasiRNA biogenesis from SmmTERF26 and regulated a subset of lineage-specific SmmTERFs. MIRmTERF widely existed in Nepetoideae plants and SmmTERF33 and SmmTERF45 proteins were localized in chloroplasts, mitochondria, and the cytoplasm. Smi-miRmTERF overexpression (MIRMTERF#OE) resulted in a dwarfing phenotype with severe defects in chloroplast and mitochondrial morphogenesis. Transcriptomic analysis showed up-regulation of defense-related and down-regulation of photosynthesis-related genes in MIRMTERF#OE plants. Under norflurazon and lincomycin treatments, MIRMTERF#OE plants displayed a gun phenotype, indicating the role of smi-miRmTERF in retrograde signaling. Furthermore, MIRMTERF#OE plants showed increased contents of phenolic acids, monoterpenoids, and sesquiterpenoids and reduced susceptibility to pathogenic bacteria Pst DC3000. The results suggest that smi-miRmTERF is a significant regulator of chloroplast and mitochondrial development, retrograde signaling, secondary metabolism, and immunity in S. miltiorrhiza.

Keywords: Salvia miltiorrhiza; SmmTERFs; immune response; miRmTERF; phasiRNA; retrograde signaling.


Conflict of interest statement

Declarations. Ethics approval and consent to participate: Not applicable. Consent for publication: Not applicable. Competing interests: The authors declare that they have no conflict of interest.

Figures

Fig. 1
Fig. 1
Phylogenetic analysis of mTERF proteins and expression profiles of SmmTERF genes. A Phylogenetic analysis of mTERF proteins in S. miltiorrhiza, Arabidopsis and maize. The phylogenetic tree was constructed using TBtools software and divided into 8 clades (Clade I-VIII) (Chen et al. 2020). The clades are indicated by different colors. Bootstrap values are showed at each node and only bootstrap values > 60% are shown. Four rectangle colors mean different subcellular locations. Red, green, yellow and blue represent chloroplastic, mitochondrial, secretory pathway and other, respectively. B Expression profiles of SmmTERF genes in roots, stems, leaves, and flowers. Transcriptome sequencing data from two biological replicates of four tissues, including root, stem, leaf, and flower, were analyzed (Xu et al. 2015). Red and blue boxes represent high and low expression levels, respectively. The bar in the top right corner represents log2(TPM + 1) values, and different colors indicate different levels of transcripts
Fig. 2
Fig. 2
Smi-miRmTERF is a candidate regulator of SmmTERFs. A Predicted hairpin structure of Smi-MIRmTERF precursor. Mature smi-miRmTERF sequence is indicated in red. The sequence in blue represents smi-miRmTERF*. Hairpin structures of flanking sequence around the perfectly matched site were predicted using the RNA folding form of mfold software. B Prediction and validation of smi-miRmTERF-directed cleavage sites within the target SmmTERFs using the psRNATarget software and 5’-RACE assays, respectively. The length of each gene sequence is represented by the brown bar. The numbers above the brown bars represent the target position. The frequencies of the cleavage sites are shown with red arrows. C Degradome analysis showed SmmTERF33 and SmmTERF45 to be targeted for cleavage by smi-miRmTERF. Red spots indicate that the products are resulted from miRmTERF-directed cleavage. D Expression analysis of smi-miRmTERF and target SmmTERFs in four tissues. The read abundance of smi-miRmTERF and target SmmTERFs was normalized and expressed as RPM (reads per million) and TPM (transcripts per million) in each tissue, respectively. Red and blue boxes represent high and low expression levels, respectively, and different colors indicate different levels of reads or transcripts. Small RNA database and transcriptome sequencing data of four tissues used in this work were previously published (Xu et al. ; Zhou et al. 2019, 2024). (E)Smi-miRmTERF-triggered phasiRNA production from SmmTERF33 in S. miltiorrhiza. Diagrams illustrating the pattern and position of phasiRNAs generated from SmmTERF33 transcripts. Smi-miRmTERF cleavage sites (aquamarine stars) were confirmed by 5ꞌ RLM-RACE and degradome data analysis. The generated phasiRNAs are numbered in order (D1, 2, 3, etc.) with strand information indicated in three colors (aquamarine represents plus strand, brown represents minus strand, and white represents absent). Smi-miRmTERF-mRNA parings are denoted below with the cleavage site
Fig. 3
Fig. 3
PhasiRNAs target the transcripts of SmmTERFs. A PhasiRNAs generated from SmmTERF26 were triggered by SmmTERF33-siRD10(-) and SmmTERF45-siRD10(-). Red arrow indicates the cleavage site. The number before the red arrow represents the frequency of cleavage site determined by 5ꞌ RLM-RACE. (BD) SmmTERF26 (B), SmmTERF39 (C), and SmmTERF45 (D) were targeted by phasiRNAs. The cleavage sites were validated by degradome data. Red dots represent cleavage sites of smi-miRmTERF. Green dots and blue squares represent cleavage sites of phasiRNAs
Fig. 4
Fig. 4
MIRMTERF#OE impaired morphogenesis of chloroplasts and mitochondria in S. miltiorrhiza. A Representative picture showing plant architecture of two-month-old MIRMTERF#OE lines (#2, #6, and #7) and WT plants under normal growth conditions. All of MIRMTERF#OE lines displayed a dwarfing phenotype compared with WT. B Leaf phenotypes of MIRMTERF#OE (#2, #6, and #7) and WT plants. All of MIRMTERF#OE lines displayed a pale-mottled leaf phenotype compared with WT. C Expression levels of smi-miRmTERF, SmmTERF33 and SmmTERF45 in MIRMTERF#OE lines (#2, #5, #6, #7 and #8) and WT plants. Leaves were harvested from two-month-old plantlets. Expression levels were analyzed using qRT-PCR. Values represent mean ± standard deviations (SD) (n = 3). Statistically significance between transgenic and WT plants is marked with asterisks (*, P < 0.05; **, P < 0.01; ***, P < 0.001; Student’s t-test). D, E Ultrastructure of chloroplasts (D) and mitochondria (E) in MIRMTERF#OE (#2 and #7) and WT plants. V, vacuole; Ch, chloroplast; M, mitochondrion; S, starch grain; GL, grana lamella; SL, stroma lamella; O, osmophilic gramules. F, G Localization of SmmTERF33 and SmmTERF45 in chloroplasts (F), mitochondria (G), and the cytoplasm (F, G). Fluorescence of GFP and chloroplast red fluorescence visualized under confocal microscopy. BF, bright field; MitoRed, mCherry mitochondrial marker. White arrows represent mitochondrial location
Fig. 5
Fig. 5
Transcriptomic analyses of MIRMTERF#OE and WT plants. A Heatmap (blue, low and red, high) of differentially expressed genes (DEGs) expressed in five MIRMTERF#OE lines and three WT plants. B Heatmap (blue, low and red, high) of smi-miRmTERF-targeting SmmTERFs expressed in five MIRMTERF#OE lines and three WT plants. C KEGG pathway enrichment analysis of DEGs between MIRMTERF#OE and WT plants. KEGG pathway enrichment analysis of DEGs was performed using R based on the hypergeometric distribution. The top 10 KEGG pathways with the DEG counts above two and -log10pValue in order from largest to smallest in the Up- and Down-regulated genes were showed
Fig. 6
Fig. 6
MIRMTERF#OE confers a gun phenotype and regulates nuclear gene expression. A Heatmap of chloroplast genes expressed in MIRMTERF#OE and WT plants. Green lines represent significantly down-regulated chloroplast genes. B KEGG maps of photosynthesis and photosynthesis-antenna protein pathways. The red box indicates up-regulated. Blue boxes indicate down-regulated. The yellow box indicates both up- and down-regulated. Heatmaps of down-regulated DEGs in photosynthesis (group A), photosynthesis-antenna protein pathways (group B), and carbon fixation in photosynthetic organism pathway (group C) are shown at the bottom. C qRT-PCR analysis of representative PhANGs under NF or Lin treatment. D Inhibition of smi-miRmTERF expression and induction of SmmTERF accumulation by Lin or NF treatment. Values are means ± SD (n = 3). Statistically significant differences are marked with asterisks (*, P < 0.05; **, P < 0.01; ***, P < 0.001; Student’s t-test)
Fig. 7
Fig. 7
Effects of MIRMTERF#OE on the biosynthesis of phenolic acids, monoterpenoids, and sesquiterpenoids. A, B The contents of six phenolic acid compounds in MIRMTERF#OE and WT plants. LA, lithospermic acid; CA, caffeic acid; PA, protocatechuic aldehyde; SAB, salvianolic acid B; SAA, salvianolic acid A; RA, rosmarinic acid. C The expression heatmap of up-regulated key enzyme genes involved in phenolic acid biosynthesis. D The contents of monoterpenoids and sesquiterpenoids in MIRMTERF#OE and WT plants. MT, monoterpenoid; ST, sesquiterpenoid. Values represent means ± SD of three biological replicates. Statistically significant differences are marked with asterisks (*, P < 0.05; **, P < 0.01; ***, P < 0.001; Student’s t-test). E Local ion flow diagrams of hexane extracts in MIRMTERF#OE and WT plants. 1, α-Pinene; 2, Camphene; 3, Sabinene; 4, β-Pinene; 5, β-Myrcene; 6, β-Thujene; 7, α-Copaene; 8, β-Elemene; 9, β-Caryophyllene; 10, α-Humulene; 11, Germacrene D; 12, β-Cadinene. F The MEP and MVA pathways associated with terpenoid biosynthesis and the expression heatmap of key enzyme genes involved in monoterpenoid and sesquiterpenoid biosynthesis. Green line represents significantly down-regulated MEP pathway genes. Red line represents significantly up-regulated MVA pathway genes
Fig. 8
Fig. 8
MIRMTERF#OE activated immune defense system and enhanced pathogen resistance in S. miltiorrhiza. A Genes putatively involved in plant-pathogen interaction pathway. Red and blue represent higher and lower transcript levels, respectively. Solid and dashed arrows represent direct activation and indirect effect, respectively. Solid lines represent binding reactions. CNGC, cyclic nucleotide-gated channel gene; RAR1, disease resistance protein. B Heatmap of the expression profile of up-regulated SmMAPKs. CE Phenotype (C) and bacterial cell growth (D, E) of MIRMTERF#OE and WT plants inoculated with the pathogen Pst DC3000. Red arrows represent necrotic spots (C). Plants were infiltrated (D) and dipped (E) with mock or bacterial cells and incubated for 3 days before taking photograph and counting bacterial titers. The bars (D, E) represent the means of four biological replicates ± SD. Each replicate comprised four challenged leaves per plant. The experiments were repeated at least three times with similar results. Statistically significant differences between OE# and WT plants are marked with asterisks (*, P < 0.05; **, P < 0.01; ***, P < 0.001; Student’s t-test). Bar, 1 cm

Similar articles

References

    1. Allen E, Xie Z, Gustafson AM, Carrington JC. MicroRNA-directed phasing during trans-acting siRNA biogenesis in plants. Cell. 2005;121:207–21. - PubMed
    1. Altschul SF, Madden TL, Schaffer AA, Zhang J, Zhang Z, Miller W, et al. Gapped BLAST and PSI-BLAST: a new generation of protein database search programs. Nucleic Acids Res. 1997;25:3389–402. - PMC - PubMed
    1. Andreasson E, Jenkins T, Brodersen P, Thorgrimsen S, Petersen NH, Zhu S, et al. The MAP kinase substrate MKS1 is a regulator of plant defense responses. EMBO J. 2005;24:2579–89. - PMC - PubMed
    1. Bailey TL, Boden M, Buske FA, Frith M, Grant CE, Clementi L, et al. MEME SUITE: tools for motif discovery and searching. Nucleic Acids Res. 2009;37:W202-208. - PMC - PubMed
    1. Barczak-Brzyżek A, Brzyżek G, Koter M, Siedlecka E, Gawroński P, Filipecki M. Plastid retrograde regulation of miRNA expression in response to light stress. BMC Plant Biol. 2022;22:150. - PMC - PubMed

LinkOut - more resources