

Diffusion MRI in the cortex of the brain: Reducing partial volume effects from CSF and white matter in the mean diffusivity using high b-values and spherical b-tensor encoding
- PMID: 40468575
- PMCID: PMC12202729
- DOI: 10.1002/mrm.30552
Diffusion MRI in the cortex of the brain: Reducing partial volume effects from CSF and white matter in the mean diffusivity using high b-values and spherical b-tensor encoding
Abstract
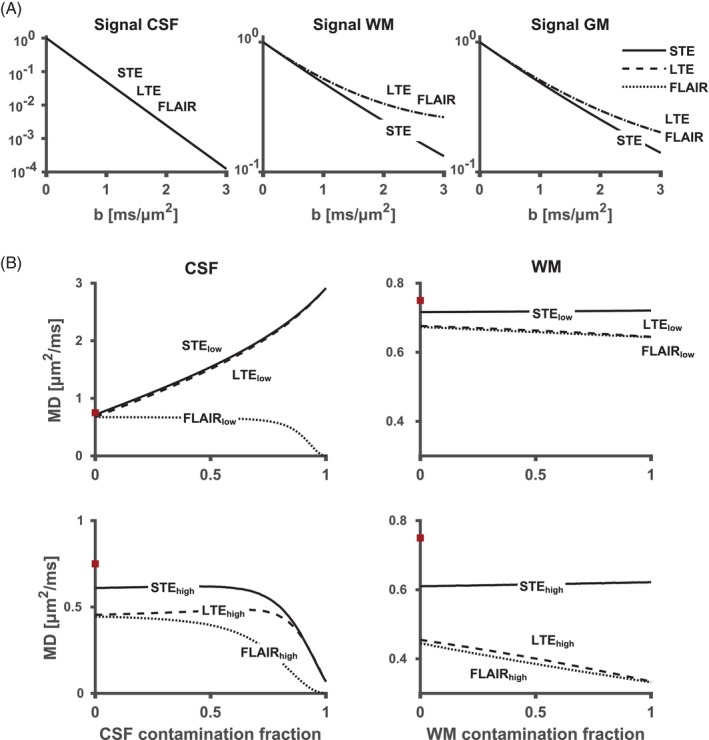
Purpose: The mean diffusivity (MD) is sensitive to the microstructure of the cortex. However, partial volume effects with CSF and white matter (WM) may obscure pathology-related alterations. This work investigates both existing approaches and a novel approach for reducing partial volume effects.
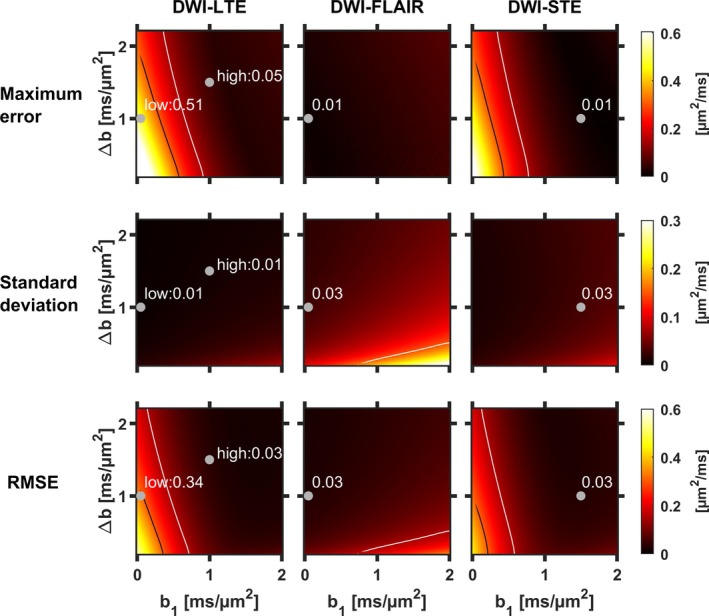
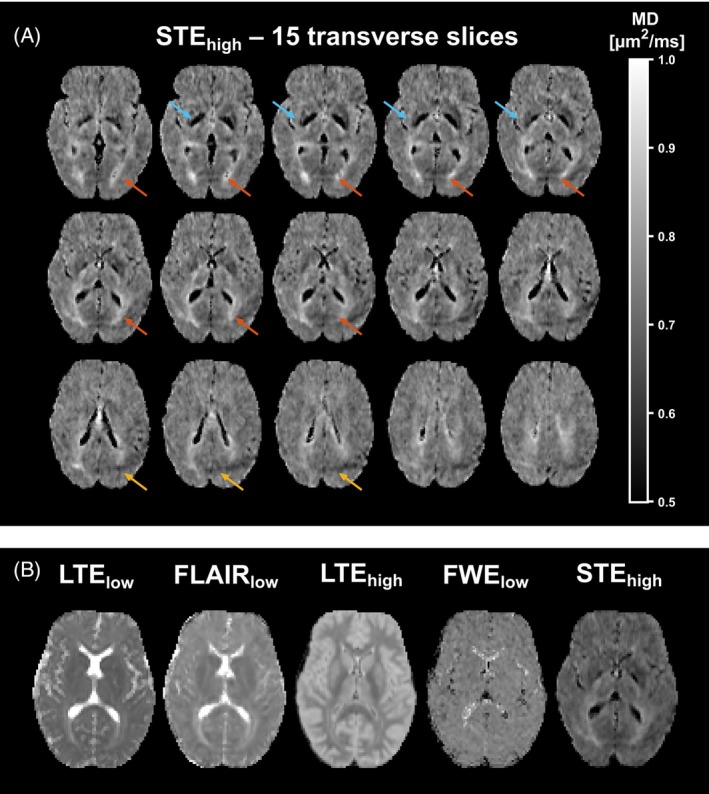
Theory and methods: A bias in MD arises due to partial volume effects, higher-order terms, and the noise floor in magnitude data. We propose to reduce this bias by using high b-value encoding to limit partial volume effects with CSF, spherical b-tensor encoding to reduce the influence of higher-order terms, and super-resolution acquisition and reconstruction to suppress the noise floor. This approach was investigated, along with established approaches (inversion recovery and free water elimination) for reducing partial volume effects, using simulations and in vivo data.
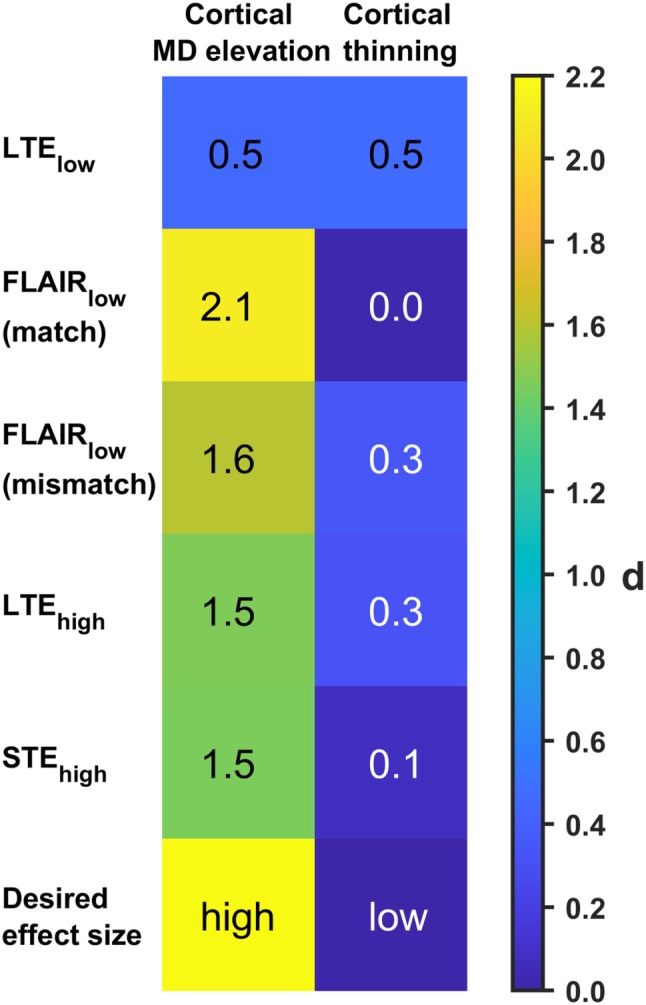
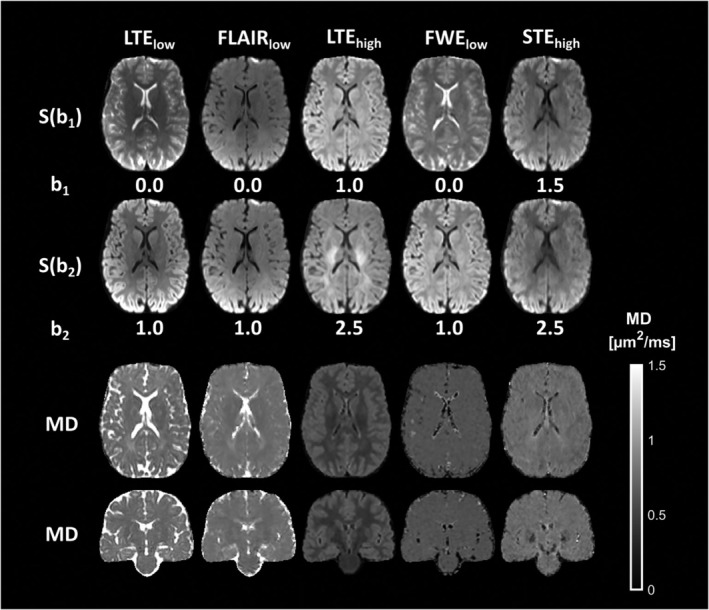
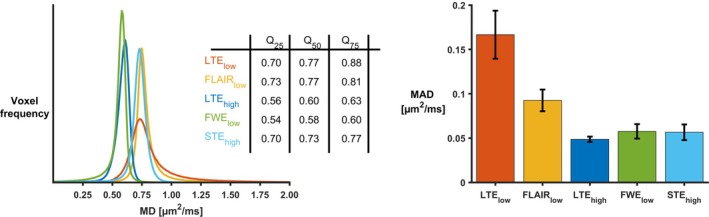
Results: High b-value diffusion MRI with spherical b-tensor encoding reduced partial volume effects with CSF relative to conventional diffusion MRI. Maximum errors decreased from 0.51 to 0.01 μm2/ms in simulations. In vivo, the median absolute deviation of cortical MD decreased from 0.17 to 0.06 μm2/ms, whereas the median decreased slightly from 0.77 to 0.73 μm2/ms. The other methods yielded bias from either CSF, WM, or model assumptions.
Conclusion: The mean diffusivity of the cortex can be mapped in high precision with reduced influence of partial volume effects with CSF and WM matter using high b-values and spherical b-tensor encoding and super-resolution reconstruction.
Keywords: cortex; diffusion MRI; high b‐values; mean diffusivity; partial volume effects; spherical b‐tensor encoding.
© 2025 The Author(s). Magnetic Resonance in Medicine published by Wiley Periodicals LLC on behalf of International Society for Magnetic Resonance in Medicine.
Figures
Similar articles
-
Characterizing the microstructural transition at the gray matter-white matter interface: Implementation and demonstration of age-associated differences.Neuroimage. 2025 Feb 1;306:121019. doi: 10.1016/j.neuroimage.2025.121019. Epub 2025 Jan 12. Neuroimage. 2025. PMID: 39809374 Free PMC article.
-
Associations of Central Arterial Stiffness With Brain White Matter Integrity and Gray Matter Volume in MRI Across the Adult Lifespan.J Magn Reson Imaging. 2025 Jul;62(1):215-229. doi: 10.1002/jmri.29713. Epub 2025 Jan 10. J Magn Reson Imaging. 2025. PMID: 39792583 Free PMC article.
-
Compartmental anisotropy of filtered exchange imaging (FEXI) in human white matter: What is happening in FEXI?Magn Reson Med. 2024 Aug;92(2):660-675. doi: 10.1002/mrm.30086. Epub 2024 Mar 25. Magn Reson Med. 2024. PMID: 38525601 Free PMC article.
-
Translating state-of-the-art spinal cord MRI techniques to clinical use: A systematic review of clinical studies utilizing DTI, MT, MWF, MRS, and fMRI.Neuroimage Clin. 2015 Dec 4;10:192-238. doi: 10.1016/j.nicl.2015.11.019. eCollection 2016. Neuroimage Clin. 2015. PMID: 26862478 Free PMC article.
-
Magnetic resonance perfusion for differentiating low-grade from high-grade gliomas at first presentation.Cochrane Database Syst Rev. 2018 Jan 22;1(1):CD011551. doi: 10.1002/14651858.CD011551.pub2. Cochrane Database Syst Rev. 2018. PMID: 29357120 Free PMC article.
References
-
- Montal V, Vilaplana E, Alcolea D, et al. Cortical microstructural changes along the Alzheimer's disease continuum. Alzheimers Dement. 2018;14:340‐351. - PubMed
-
- Chen Q, Liu S, Li C‐X, et al. MRI‐negative refractory partial epilepsy: role for diffusion tensor imaging in high field MRI. Epilepsy Res. 2008;80:83‐89. - PubMed
MeSH terms
Grants and funding
- FO2024-0335-HK-73/Hjärnfonden
- 2024-04968/Vetenskapsrådet
- 2022/1528 Pj/Cancerfonden
- 22 0592 JIA/Cancerfonden
- Swedish governmental funding of clinical research (ALF)
- 2020-04549/Vetenskapsrådet
- 20240888/Crafoordska Stiftelsen
- 2021-04844/Vetenskapsrådet
- 2022/2414/Cancerfonden
- 10/Strategic Research environment (eSSENCE)
- R01 NS125781/NS/NINDS NIH HHS/United States
- 22 2011 Pj/Cancerfonden
- 5R01NS125781/NS/NINDS NIH HHS/United States
- 5/Strategic Research environment (eSSENCE)
LinkOut - more resources
Full Text Sources
