. 2025 Sep;98(3):573-589.
doi: 10.1002/ana.27277. Epub 2025 Jun 5.

HCN2-Associated Neurodevelopmental Disorders: Data from Patients and Xenopus Cell Models

Affiliations

HCN2-Associated Neurodevelopmental Disorders: Data from Patients and Xenopus Cell Models

Clara Houdayer et al. Ann Neurol. 2025 Sep.

Abstract

Objective: We aimed to characterize the phenotypic spectrum and functional consequences associated with variants in HCN2, encoding for the hyperpolarization-activated cyclic nucleotide (HCN) gated channel 2.

Methods: GeneMatcher facilitated the recruitment of 21 individuals with HCN2 variants from 15 unrelated families, carrying HCN2 variants. In vitro functional studies were performed by electrophysiology with Xenopus laevis oocytes and membrane trafficking was investigated in HEK cells by confocal imaging. Structural 3D-analysis of the HCN2 variants was performed.

Results: The phenotypic spectrum included developmental delay/intellectual disability (DD/ID, 17/21), epilepsy (10/21), language disorders (16/21), movement disorders (12/21), and axial hypotonia (10/21). Thirteen pathogenic variants (12 new and 1 already described) were identified: 11 missense (8 monoallelic and 3 biallelic), 1 recurrent inframe deletion (monoallelic), and 1 frameshift (biallelic). Functional analysis of p.(Arg324His) variant showed a strong increase of HCN2 conductance, whereas p.(Ala363Val) and p.(Met374Leu) exhibited dominant negative effects. The p.(Leu377His), p.(Pro493Leu), and p.(Gly587Asp) variants rendered HCN2 electrophysiologically silent and impaired membrane trafficking. Structural 3D-analysis revealed that, except for p.(Arg324His), all variants altered HCN2 stability.

Interpretation: Our findings broadened the HCN2 disease clinical spectrum to include DD/ID with or without epilepsy. Functional analysis in cellular models reveal that pathogenic HCN2 variants can cause either loss-of-function or gain-of-function, providing critical information for the development of targeted therapies for HCN2-related disorders. ANN NEUROL 2025;98:573-589.


Conflict of interest statement

The authors have no conflict of interest to declare.

Figures
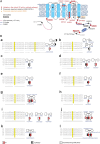
FIGURE 1
FIGURE 1
Pedigrees and HCN2 pathogenic variants. (A) HCN2 channel and pathogenic variants. Stars indicate HCN2 variants identified in this work, and crosses indicate those previously reported. Biallelic variants are underlined whereas monoallelic variants are not. (B) Pedigrees of individuals I1 to 21 and multi‐species sequence alignment of the mutated HCN2 channels (a–i). Sequence alignment was performed using Clustal Omega (Uniprot entries: A0A8N7T6V3 [Danio rerio], A0A8V1AGR5 [Gallus gallus], O88703 [Mus musculus], Q9UL51 [Homo sapiens]). Below the sequence alignment, a key denotes: conserved amino acid (*), conservative replacement (:), and non‐conservative replacement (). When not mentioned, the individual's genotype is unknown. [Color figure can be viewed at www.annalsofneurology.org]
FIGURE 2
FIGURE 2
Cerebral MRI from individuals carrying the p.(Ala363Val), the p.(Asn369Ser), and the p.(Glu478del) variants. (A) Axial FLAIR MRI image from individual I7 show atrophy and an increase of ventricular spaces (arrows). Individual I7 carries the p.(Ala363Val) variant. (B, C) Axial brain MRI images show mild T2 signal changes in the periventricular white matter posteriorly in individual I8, carrying the p.(Asn369Ser) variant. (D–H) Axial MRI scans of individuals carrying the p.(Glu478del). (D–F) Axial FLAIR MRI images of individual I13 show periventricular white matter abnormalities. (F) Sagittal T2‐weighted image shows superior vermis atrophy (arrow C). (G, H) Axial T2‐weighted image through the centrum semiovale of individual I14 demonstrates a hyperintense signal involving the periventricular white matter with posterior predominance (arrows D). T2‐weighted signal hyperintensity is also present in the ventrolateral thalami (E arrows), as well as the optic radiations and subcortical occipital white matter (E arrow heads). (J, K) Axial T2‐weight images demonstrate posterior mild diffuse periventricular hyperintensity signal abnormality that extended into the posterior capsule into the thalami bilaterally in individual I15. FLAIR = fluid‐attenuated inversion recovery; MRI = magnetic resonance imaging. [Color figure can be viewed at www.annalsofneurology.org]
FIGURE 3
FIGURE 3
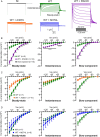
Electrophysiological characterization of the monoallelic variants, p.(Arg324His), p.(Ala363Val), and p.(Met374Leu). (A) Examples of superimposed current traces, developed in response to hyperpolarized stimulations. From left to right, are examples of currents elicited by uninjected oocytes (NI), wt‐HCN2 channel (WT), wt/p.(Arg324His) (WT + R324H), wt/p.(Ala363Val) (WT + A363V), and wt/p.(Met374Leu) (WT + M374L) channels, respectively. (B–D) From left to right, the I/V curves were generated using current densities measured at the steady‐state and instantaneous components. Current densities for the slow component were then calculated. For each variant, significance of difference with wt‐HCN2 was analyzed with a 2‐way ANOVA test (corrected with Geisser–Greenhouse method), followed by a comparison test (2‐stage step‐up method of Benjamini, Kriger, and Yekutieli). Data are shown as mean ± SEM. For clarity, no information indicates no significance. *, p < 0.05; **, p < 0.01; ***, p < 0,001; ****, p < 0.0001. ANOVA = analysis of variance; WT = wild type. [Color figure can be viewed at www.annalsofneurology.org]
FIGURE 4
FIGURE 4
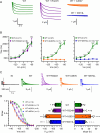
Activation kinetics and tail current analysis for the monoallelic variants, p.(Arg324His), p.(Ala363Val), and p.(Met374Leu). (A) Examples of traces showing the slow component of currents elicited by wt‐HCN2 channel (WT), wt/p.(Arg324His) (WT + R324H), wt/p.(Ala363Val) (WT + A363V), and wt/p.(Met374Leu) (WT + M374L) channels, respectively. (B) Activating current kinetics analysis. Current traces were well‐fitted with a single exponential equation. Tau (ms) was plotted versus Vm (mV). For each variant, significance of difference with wt‐HCN2 was analyzed with a 2‐way ANOVA test (corrected with Geisser–Greenhouse method), followed by a comparison test (2‐stage step‐up method of Benjamini, Kriger, and Yekutieli). (C) Representative tail current traces for wt‐HCN2 channel (WT), wt/p.(Arg324His) (WT + R324H), wt/p.(Ala363Val) (WT + A363V), and wt/p.(Met374Leu) (WT + M374L) channels, respectively. (D) The left panel shows the normalized current amplitudes (I/Imax) versus Vm were fitted with the Boltzmann equation (see Supporting Information), allowing the determination of the half‐activation potentials (V1/2) and the slope factor k. The right panel shows the scatter plots of the comparison of the V1/2 (left) and slope factor (right) of the wt‐HCN2, wt/p.(Ala363Val), wt/p.(Met374Leu), and wt/p.(Arg324His) mutant channels. A 1‐way ANOVA test (F = 53,15, p < 0.0001), followed by a Dunnett test, was performed and showed a significant difference between mutants and wt‐HCN2, except between the p.(Arg324His) and wt‐ HCN2 (p = 0.48). Data are shown as mean ± SEM. ns, not significant; *, p < 0.05; **, p < 0.01; ***, p < 0,001; ****, p < 0.0001. ANOVA = analysis of variance; WT = wild type. [Color figure can be viewed at www.annalsofneurology.org]
FIGURE 5
FIGURE 5
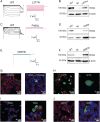
Characterization of the p.(Leu377His), the p.(Pro493Leu), and the p.(Gly587Asp) HCN2 variants. (A, C, and E) Representative TEVC recordings from oocytes expressing HCN2 wild‐type and 2 homozygous variants of HCN2, p.(Leu377His), p.(Pro493Leu), and p.(Gly587Asp). The data show current traces for voltage steps from −130 to −30 mV from a holding potential of −30 mV for 10 seconds. (B, D, and F) Western blot of Xenopus laevis oocyte proteins. The panels show immunostaining with anti‐HCN2 and anti‐β‐Actin antibodies. WT: Oocytes injected with wt‐HCN2 mRNA, NI: Non‐injected oocytes; L377H, P493L and G587D: Oocytes injected with the p.(Leu377His), the p.(Pro493Leu), and the p.(Gly587Asp) variants mRNAs, respectively. (G, H, J) Study of membrane trafficking of the p.(Leu377His), the p.(Pro493Leu), and the p.(Gly587Asp) variants in HEK293 cells. The expression of EGFP‐tagged the p.(Leu377His) or the p.(Pro493Leu) or the p.(Gly587Asp) HCN2 variants was evaluated by confocal microscopy. The cells were stained with the CellMask orange membrane stain and DAPi nuclear stain. EGFP‐tagged wt‐HCN2 (G, left panel) shows a strong EGFP signal at the plasma membrane, while the trafficking‐defected HCN2ΔC‐X (Thr553Ter) shows cytosolic staining (G, right panel), as seen for the p.(Leu377His), the p.(Pro493Leu), and the p.(Gly587Asp) variants (H, I, J). Examples of images obtained from magnification of 63× are shown (G and H–J, left panels). Examples of overview with magnification from 20× are also shown (H–J, left panels). TEVC = 2‐electrode voltage‐clamp method; WT = wild type. [Color figure can be viewed at www.annalsofneurology.org]
FIGURE 6
FIGURE 6
Structural analysis of the monoallelic pathogenic HCN2 variants, p.(Arg324His), p.(Ala363Val), and p.(M374Leu). (A) Mutation mapping onto 3D homology model of HCN2. Profile view of HCN2 3D structure in depolarized state, showing R324, A363, and M374 positions. For clarity, the chains A and C were hidden. The approximate position of HCN2 within the membrane is visualized with the gray rectangle. The regions delimitated by the dashed box were enlarged to illustrate the closest contacts of R324, A363, and M374 in chain B in the depolarized and hyperpolarized states (B, C, D). (B) Top views of R324 (in chocolate). The side chain of residue at 324 is toward the solvent in the depolarized state of HCN2, but, after opening, it remains trapped in a hydrophobic pocket formed by I233, K237, A320, R321, F328, L387, M390, and L391. The side chain of His fits well in this hydrophobic pocket. (C and D) Profile views of S5 to S6 interfaces showing the residues A363 and M374 and their hydrophobic interactions with their closest neighbor contacts. The hydrophobic interactions (in green dashed lines) are stronger in the p.(Ala363Val) and the p.(M374Leu) variants. In the p.(M374Leu) variant, a clash is observed between L374 and C454 (D). [Color figure can be viewed at www.annalsofneurology.org]
FIGURE 7
FIGURE 7
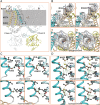
Structural analysis of the biallelic pathogenic variants, p.(Leu377His), p.(Pro493Leu) and p.(Gly587Asp). (A) Mutation mapping onto 3D homology model of HCN2. A profile view of HCN2 3D structure in depolarized stated shows L377, P493, and G587 positions. For clarity, only chains B and C were colored. The approximate position of HCN2 within the membrane is visualized with the gray rectangle. The regions delimitated by the dashed box were enlarged to illustrate the closest contacts of each amino acid residue in chain B (B, C, D). (B) Enlarged view of the S5 to S6 interface of wt‐HCN2 and p.(Leu377His) HCN2 variant in the depolarized and hyperpolarized states. In the depolarized state, the side chain of L377 is stabilized by hydrophobic interactions with M373 and V450 side chains at the interface between S5 (in cyan) and S6 (in light blue). After opening, in the hyperpolarized state, L377 forms only one hydrophobic interaction with M425, localized in the pore helix (in white). In p.(Leu377His), the hydrophobic interactions with M373 and V450 are lost and L377H interacts with M425 in both the depolarized and hyperpolarized states. (C) Enlarged view of the interface between chains B and C at the C‐termini of HCN2. P493 (chain B in the loop between helix A′ and B′) forms hydrophobic interactions with F533 (chain C) and F496 (helix B′, chain B) in the depolarized state. After opening, these hydrophobic interactions are weaker and concerns only F533. In the p.(Pro493Leu) variant, these hydrophobic interactions are partially lost, that might destabilize the bend between helices A′ and B′ and also the N‐terminal of helice B′. (D) Enlarged view of the interface between the CNBD of chains B and the N‐termini of chain C in the HCN2 structure. The p.(Gly587Asp) variant changes the curvature of the loop between 2 β‐sheets within the CNBD (in yellow). Several clashes occurred in the G587D and Y627 (chain B), and the S185 (chain C). The hydrophobic interactions are illustrated by green dashed lines and clashes are shown in pink. [Color figure can be viewed at www.annalsofneurology.org]

References

    1. Reid CA, Berkovic SF, Petrou S. Mechanisms of human inherited epilepsies. Prog Neurobiol 2009;87:41–57. - PubMed
    1. Avanzini G, Franceschetti S, Mantegazza M. Epileptogenic channelopathies: experimental models of human pathologies. Epilepsia 2007;48:51–64. - PubMed
    1. Kessi M, Chen B, Peng J, et al. Calcium channelopathies and intellectual disability: a systematic review. Orphanet J Rare Dis 2021;16:219. - PMC - PubMed
    1. Biel M, Wahl‐Schott C, Michalakis S, Zong X. Hyperpolarization‐activated cation channels: from genes to function. Physiol Rev 2009;89:847–885. - PubMed
    1. Poolos NP. Hyperpolarization‐activated cyclic nucleotide‐gated (HCN) ion channelopathy in epilepsy [Internet]. In: Noebels J, Avoli M, Rogawski M, et al., eds. Jasper's basic mechanisms of the epilepsies. Oxford: Oxford University Press, 2012:85‐96. Available from: 10.1093/med/9780199746545.001.0001/med-9780199746545-chapter-7. - DOI

Substances

LinkOut - more resources