. 2025 Jun;21(6):e70276.
doi: 10.1002/alz.70276.

LC-MS/MS proteomics identifies plasma proteins related to cognition over 9-year follow-up

Affiliations

LC-MS/MS proteomics identifies plasma proteins related to cognition over 9-year follow-up

Hailey A Adegboye et al. Alzheimers Dement. 2025 Jun.

Abstract

Introduction: This project identified plasma proteins predictive of cognitive decline across a robust neuropsychological protocol over a 9-year period.

Methods: Vanderbilt Memory and Aging Project participants (n = 336, 73 ± 7 years, 59% male, 87% non-Hispanic White, 10% Black/African American) underwent blood draw for baseline plasma protein abundance using mass spectrometry analysis of tandem mass tag (TMT)-labeled peptides and serial neuropsychological assessment (follow-up = 6.1 ± 2.3 years). Linear mixed-effects regressions related protein levels to neuropsychological outcomes in fully adjusted models. False discovery rate correction was applied.

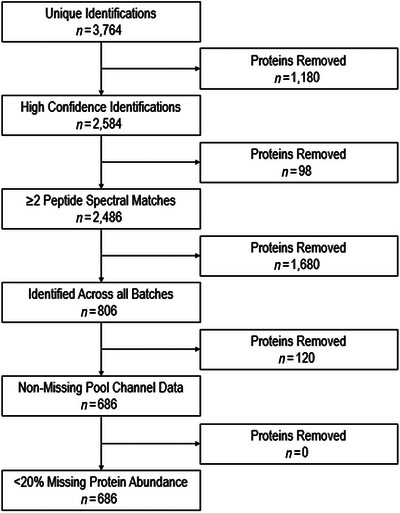
Results: Initial proteomics analyses yielded 3764 unique protein identifications across 23 16-plex TMT batches, and 686 proteins passed quality control. Proteins were identified predicting longitudinal decline in language (EGFR, RTN4RL2), information processing speed (EGFR, NOMO2, CLEC3B), executive function (A1BG), and visuospatial skills (RTN4RL2, GALNT1, SERPINA4, SERPINA5, C8A, ALDOB), but not episodic memory.

Discussion: Large-scale proteomics analyses identified 10 plasma proteins that predicted subsequent cognitive decline over a 9-year follow-up in multiple cognitive domains.

Highlights: There were 3764 unique protein identifications across 23 16-plex TMT batches. Rigorous quality control yielded 686 proteins used as predictors in analyses. Identified proteins related to all domains assessed, except for episodic memory. Many proteins identified were differentially expressed in MCI.

Keywords: Alzheimer's disease; LC‐MS/MS; cognition; mild cognitive impairment; plasma proteomics.


Conflict of interest statement

T.J.H. serves on the Scientific Advisory Board for Vivid Genomics. T.J.H. is also Deputy Editor for Alzheimer's & Dementia: Translational Research and Clinical Intervention and Senior Associate Editor for Alzheimer's & Dementia. H.Z. has served on scientific advisory boards and/or as a consultant for AbbVie, Acumen, Alector, Alzinova, ALZpath, Amylyx, Annexon, Apellis, Artery Therapeutics, AZTherapies, Cognito Therapeutics, CogRx, Denali, Eisai, LabCorp, Merry Life, Nervgen, Novo Nordisk, Optoceutics, Passage Bio, Pinteon Therapeutics, Prothena, Red Abbey Labs, reMYND, Roche, Samumed, Siemens Healthineers, Triplet Therapeutics, and Wave and has given lectures sponsored by Alzecure, BioArctic, Biogen, Cellectricon, Fujirebio, Lilly, Novo Nordisk, Roche, and WebMD. K.B. has served as a consultant and on advisory boards for AbbVie, AC Immune, ALZPath, AriBio, Beckman‐Coulter, BioArctic, Biogen, Eisai, Lilly, Moleac Pte. Ltd, Neurimmune, Novartis, Ono Pharma, Prothena, Quanterix, Roche Diagnostics, Sanofi, and Siemens Healthineers; has served on data monitoring committees for Julius Clinical and Novartis; has given lectures, produced educational materials, and participated in educational programs for AC Immune, Biogen, Celdara Medical, Eisai, and Roche Diagnostics; and is a co‐founder of Brain Biomarker Solutions in Gothenburg AB (BBS), which is a part of the GU Ventures Incubator Program, outside the work presented in this paper. H.A.A., K.L.P., J.L., Y.S., P.Z., D.L., W.H.R., A.J.P., K.R.C., A.B.A., N.C.O., M.D.W., K.R.P., L.D., C.J.B., R.A.S.R., and A.L.J. have nothing to disclose. Author disclosures are available in the Supporting Information.

Figures

FIGURE 1
FIGURE 1
Plasma proteomics data were generated on n = 336 participants. Regression analyses included n = 334 participants, due to n = 2 participants being excluded for having a dementia diagnosis at baseline (n = 1) or for missing neuropsychological assessment data at baseline (n = 1). Longitudinal follow‐up data (i.e., data captured at two or more time points) were available for 305 participants. For participants with longitudinal data available, the average follow‐up time for neuropsychological assessment is 6.1 ± 2.3 years (4.4 ± 1.1 distinct time points). N = 29 participants had only baseline data available and were included and thus only statistically contributed to the calculation of the intercept in models.
FIGURE 2
FIGURE 2
Plasma samples (n = 336) were prepared using a bottom‐up quantitative proteomics protocol previously reported. There were 3764 unique protein identifications. The first two QC steps – (1) retaining only high‐confidence identifications and (2) requiring ≥2 PSMs – were applied independently within each batch. Requiring high‐confidence identifications resulted in the removal of 2584 proteins, and requiring ≥2 PSMs resulted in the removal of an additional 98 proteins. Prior to this QC step, 97% of data points had ≥2 PSMs and 3% had only one PSM. Proteins were required to be present in all batches upon combination of the datasets, resulting in the removal of 1680 proteins. Finally, an additional 120 proteins were removed due to not having TMT abundance values represented in all 23 internal TMT Spool channels, which resulted in 686 proteins moving forward to regression analysis. A final filter requiring protein data to have passed QC in >80% of samples was applied, which did not result in the removal of any additional proteins. PSM, peptide spectral match; TMT, tandem mass tag; QC, quality control.
FIGURE 3
FIGURE 3
Solid line reflects unadjusted values for annual change in cognitive outcomes (y‐axis) corresponding to baseline plasma protein abundance (x‐axis). Shading reflects 95% confidence interval. For all cognitive outcomes illustrated above, higher raw scores (i.e., positive annual change) indicate better performance. A1BG, alpha‐1B‐glycoprotein; ALDOB, fructose‐bisphosphate aldolase B; BNT, Boston Naming Test; C8A, complement component C8 alpha chain; CLEC3B, tetranectin; EGFR, epidermal growth factor receptor; GALNT1, polypeptide N‐acetylgalactosaminyltransferase 1; HVOT, Hooper Visual Organization Test; MCI, mild cognitive impairment; NOMO2, BOS complex subunit NOMO2; RTNRL2, reticulon‐4 receptor‐like 2; SERPINA4, kallistatin; SERPINA5, plasma serine protease inhibitor; WAIS‐IV, Wechsler Adult Intelligence Scale, Fourth Edition; Panel A, EGFR and Animal Naming; Panel B, RTN4RL2 and Boston Naming Test; Panel C, EGFR and WAIS‐IV Coding; Panel D, NOMO2 and WAIS‐IV Coding; Panel E, CLEC3B and WAIS‐IV Coding; Panel F, A1BG and Executive Function; Panel G, RTN4RL2 and HVOT; Panel H, GALNT1 and HVOT; Panel I, SERPINA4 and HVOT; Panel J, SERPINA5 and HVOT; Panel K, C8A and HVOT; Panel L, ALDOB and HVOT.
FIGURE 3
FIGURE 3
Solid line reflects unadjusted values for annual change in cognitive outcomes (y‐axis) corresponding to baseline plasma protein abundance (x‐axis). Shading reflects 95% confidence interval. For all cognitive outcomes illustrated above, higher raw scores (i.e., positive annual change) indicate better performance. A1BG, alpha‐1B‐glycoprotein; ALDOB, fructose‐bisphosphate aldolase B; BNT, Boston Naming Test; C8A, complement component C8 alpha chain; CLEC3B, tetranectin; EGFR, epidermal growth factor receptor; GALNT1, polypeptide N‐acetylgalactosaminyltransferase 1; HVOT, Hooper Visual Organization Test; MCI, mild cognitive impairment; NOMO2, BOS complex subunit NOMO2; RTNRL2, reticulon‐4 receptor‐like 2; SERPINA4, kallistatin; SERPINA5, plasma serine protease inhibitor; WAIS‐IV, Wechsler Adult Intelligence Scale, Fourth Edition; Panel A, EGFR and Animal Naming; Panel B, RTN4RL2 and Boston Naming Test; Panel C, EGFR and WAIS‐IV Coding; Panel D, NOMO2 and WAIS‐IV Coding; Panel E, CLEC3B and WAIS‐IV Coding; Panel F, A1BG and Executive Function; Panel G, RTN4RL2 and HVOT; Panel H, GALNT1 and HVOT; Panel I, SERPINA4 and HVOT; Panel J, SERPINA5 and HVOT; Panel K, C8A and HVOT; Panel L, ALDOB and HVOT.
FIGURE 4
FIGURE 4
Each data point represents a plasma protein and the corresponding beta estimate (x‐axis) and −log10 transformed p value (y‐axis) from linear mixed‐effects models evaluating associations with longitudinal cognitive trajectory and adjusting for age, sex, race/ethnicity, education, APOE4 status, and baseline cognitive status. Data points are colored according to statistical significance (p > 0.05 = gray; p < 0.05, pFDR > 0.05 = black; pFDR < 0.05 = red). The beta estimate reported here represents the interaction between baseline plasma protein abundance and follow‐up time in predicting longitudinal cognitive outcomes. DKEFS Number Sequencing (Panel D) is a timed test, in which lower raw scores indicate faster and, thus, better cognitive performance. All other neuropsychological assessments are either total correct (Panels A, B, C, and F) or z‐scores (Panels E and G), in which a higher score indicates better cognitive performance. A negative beta estimate for number sequencing or a positive beta estimate for all other cognitive measures indicates that participants with lower baseline levels of the specified plasma protein exhibit faster cognitive decline over longitudinal follow‐up. A1BG, alpha‐1B‐glycoprotein; ALDOB, fructose‐bisphosphate aldolase B; C8A, complement component C8 alpha chain; CLEC3B, tetranectin; EGFR, epidermal growth factor receptor; GALNT1, polypeptide N‐acetylgalactosaminyltransferase 1; NOMO2, BOS complex subunit NOMO2; RTNRL2, reticulon‐4 receptor‐like 2; SERPINA4, kallistatin; SERPINA5, plasma serine protease inhibitor; Panel A, Animal Naming (Language); Panel B, Boston Naming Test (Language); Panel C, WAIS‐IV Coding (Information Processing Speed); Panel D, DKEFS Number Sequencing Test (Information Processing Speed); Panel E, Executive Function Composite; Panel F, Hooper Visual Organization Test (Visuospatial Abilities); Panel G, Episodic Memory Composite.
FIGURE 4
FIGURE 4
Each data point represents a plasma protein and the corresponding beta estimate (x‐axis) and −log10 transformed p value (y‐axis) from linear mixed‐effects models evaluating associations with longitudinal cognitive trajectory and adjusting for age, sex, race/ethnicity, education, APOE4 status, and baseline cognitive status. Data points are colored according to statistical significance (p > 0.05 = gray; p < 0.05, pFDR > 0.05 = black; pFDR < 0.05 = red). The beta estimate reported here represents the interaction between baseline plasma protein abundance and follow‐up time in predicting longitudinal cognitive outcomes. DKEFS Number Sequencing (Panel D) is a timed test, in which lower raw scores indicate faster and, thus, better cognitive performance. All other neuropsychological assessments are either total correct (Panels A, B, C, and F) or z‐scores (Panels E and G), in which a higher score indicates better cognitive performance. A negative beta estimate for number sequencing or a positive beta estimate for all other cognitive measures indicates that participants with lower baseline levels of the specified plasma protein exhibit faster cognitive decline over longitudinal follow‐up. A1BG, alpha‐1B‐glycoprotein; ALDOB, fructose‐bisphosphate aldolase B; C8A, complement component C8 alpha chain; CLEC3B, tetranectin; EGFR, epidermal growth factor receptor; GALNT1, polypeptide N‐acetylgalactosaminyltransferase 1; NOMO2, BOS complex subunit NOMO2; RTNRL2, reticulon‐4 receptor‐like 2; SERPINA4, kallistatin; SERPINA5, plasma serine protease inhibitor; Panel A, Animal Naming (Language); Panel B, Boston Naming Test (Language); Panel C, WAIS‐IV Coding (Information Processing Speed); Panel D, DKEFS Number Sequencing Test (Information Processing Speed); Panel E, Executive Function Composite; Panel F, Hooper Visual Organization Test (Visuospatial Abilities); Panel G, Episodic Memory Composite.
FIGURE 5
FIGURE 5
Baseline plasma abundance (y‐axis) plotted as a function of baseline cognitive status (x‐axis, CU, MCI). Analysis of covariance models were adjusted for age, sex, race/ethnicity, education, and APOE4 status. (A–G) Proteins with statistically significant cognitive status group differences. (H–J) Proteins for which plasma abundance was not statistically different between cognitive status groups. ALDOB, fructose‐bisphosphate aldolase B; C8A, complement component C8 alpha chain; CLEC3B, tetranectin; CU, cognitively unimpaired; EGFR, epidermal growth factor receptor; GALNT1, polypeptide N‐acetylgalactosaminyltransferase 1; MCI, mild cognitive impairment; NOMO2, BOS complex subunit NOMO2; RTNRL2, reticulon‐4 receptor‐like 2; SERPINA4, kallistatin; SERPINA5, plasma serine protease inhibitor. Panel A, RTN4RL2. Panel B, ALDOB. Panel C, NOMO2. Panel D, A1BG. Panel E, C8A. Panel F, SERPINA4. Panel G, SERPINA5. Panel H, EGFR. Panel I, CLEC3B. Panel J, GALNT1.
FIGURE 5
FIGURE 5
Baseline plasma abundance (y‐axis) plotted as a function of baseline cognitive status (x‐axis, CU, MCI). Analysis of covariance models were adjusted for age, sex, race/ethnicity, education, and APOE4 status. (A–G) Proteins with statistically significant cognitive status group differences. (H–J) Proteins for which plasma abundance was not statistically different between cognitive status groups. ALDOB, fructose‐bisphosphate aldolase B; C8A, complement component C8 alpha chain; CLEC3B, tetranectin; CU, cognitively unimpaired; EGFR, epidermal growth factor receptor; GALNT1, polypeptide N‐acetylgalactosaminyltransferase 1; MCI, mild cognitive impairment; NOMO2, BOS complex subunit NOMO2; RTNRL2, reticulon‐4 receptor‐like 2; SERPINA4, kallistatin; SERPINA5, plasma serine protease inhibitor. Panel A, RTN4RL2. Panel B, ALDOB. Panel C, NOMO2. Panel D, A1BG. Panel E, C8A. Panel F, SERPINA4. Panel G, SERPINA5. Panel H, EGFR. Panel I, CLEC3B. Panel J, GALNT1.
FIGURE 6
FIGURE 6
Plasma proteins found to be predictive of decline on at least one neuropsychological assessment were submitted to the STRING database to assess interconnectivity among identified proteins based on functional associations previously reported in the literature, and the custom background was set to only consider proteins included in analytical models (n protein = 686). Default parameters were used for STRING analyses. A1BG, alpha‐1B glycoprotein; ALDOB, fructose‐bisphosphate aldolase B; C8A, complement component C8 alpha chain; CLEC3B, tetranectin; EGFR, epidermal growth factor receptor; GALNT1, polypeptide N‐acetylgalactosaminyltransferase 1; NOMO2, BOS complex subunit NOMO2; RTNRL2, reticulon‐4 receptor‐like 2; SERPINA4, kallistatin; SERPINA5, plasma serine protease inhibitor; STRING, Search Tool for the Retrieval of Interacting Genes.

Similar articles

References

    1. Pais MV, Forlenza OV, Diniz BS. Plasma biomarkers of Alzheimer's disease: a review of available assays, recent developments, and implications for clinical practice. J Alzheimers Dis Rep. 2023;7:355‐380. doi:10.3233/ADR-230029 - DOI - PMC - PubMed
    1. Hansson O, Edelmayer RM, Boxer AL, et al. The Alzheimer's Association appropriate use recommendations for blood biomarkers in Alzheimer's disease. Alzheimers Dement J Alzheimers Assoc. 2022;18:2669‐2686. doi:10.1002/alz.12756 - DOI - PMC - PubMed
    1. Teunissen CE, Verberk IMW, Thijssen EH, et al. Blood‐based biomarkers for Alzheimer's disease: towards clinical implementation. Lancet Neurol. 2022;21:66‐77. doi:10.1016/S1474-4422(21)00361-6 - DOI - PubMed
    1. Budd Haeberlein S, Aisen PS, Barkhof F, et al. Two randomized phase 3 studies of aducanumab in early Alzheimer's disease. J Prev Alzheimers Dis. 2022;9:197‐210. doi:10.14283/jpad.2022.30 - DOI - PubMed
    1. van Dyck CH, Swanson CJ, Aisen P, et al. Lecanemab in early Alzheimer's disease. N Engl J Med. 2023;388:9‐21. doi:10.1056/NEJMoa2212948 - DOI - PubMed

Grants and funding