

Predominant T-cell epitopes of SARS-CoV-2 restricted by multiple prevalent HLA-B and HLA-C allotypes in Northeast Asia
- PMID: 40469303
- PMCID: PMC12133982
- DOI: 10.3389/fimmu.2025.1545510
Predominant T-cell epitopes of SARS-CoV-2 restricted by multiple prevalent HLA-B and HLA-C allotypes in Northeast Asia
Abstract
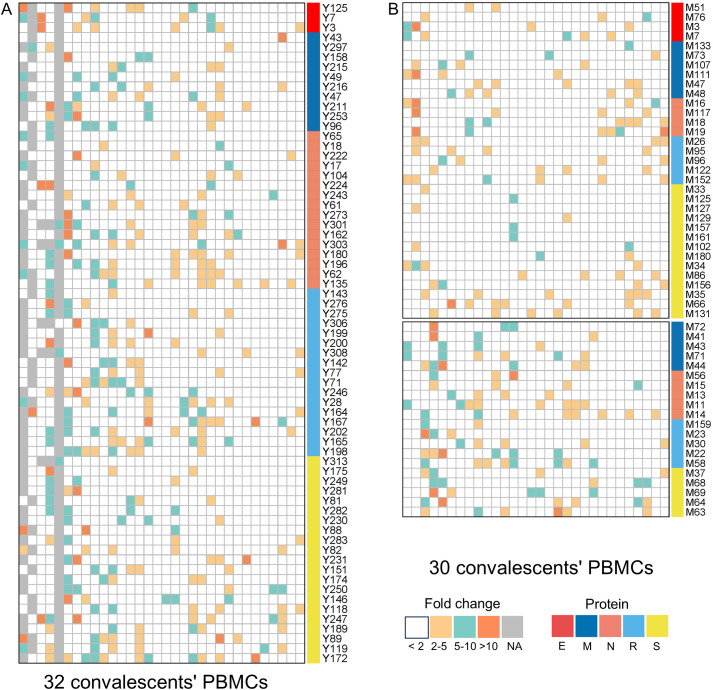
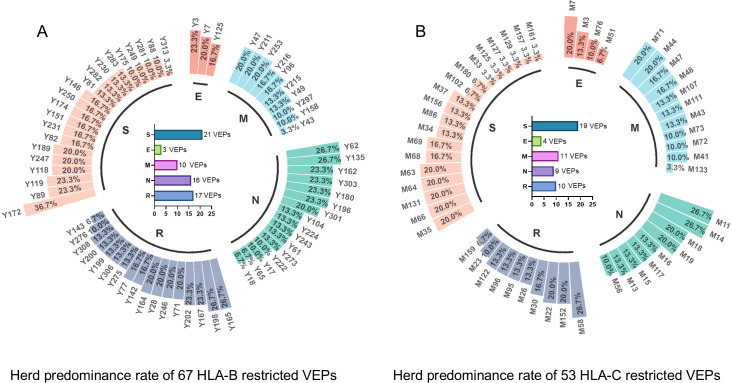
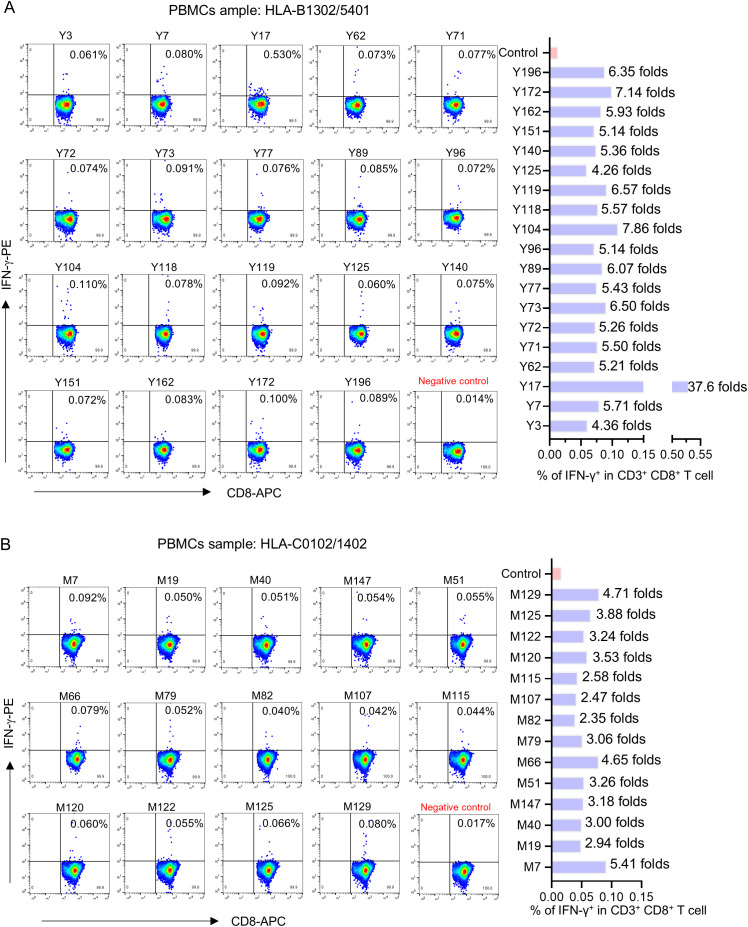
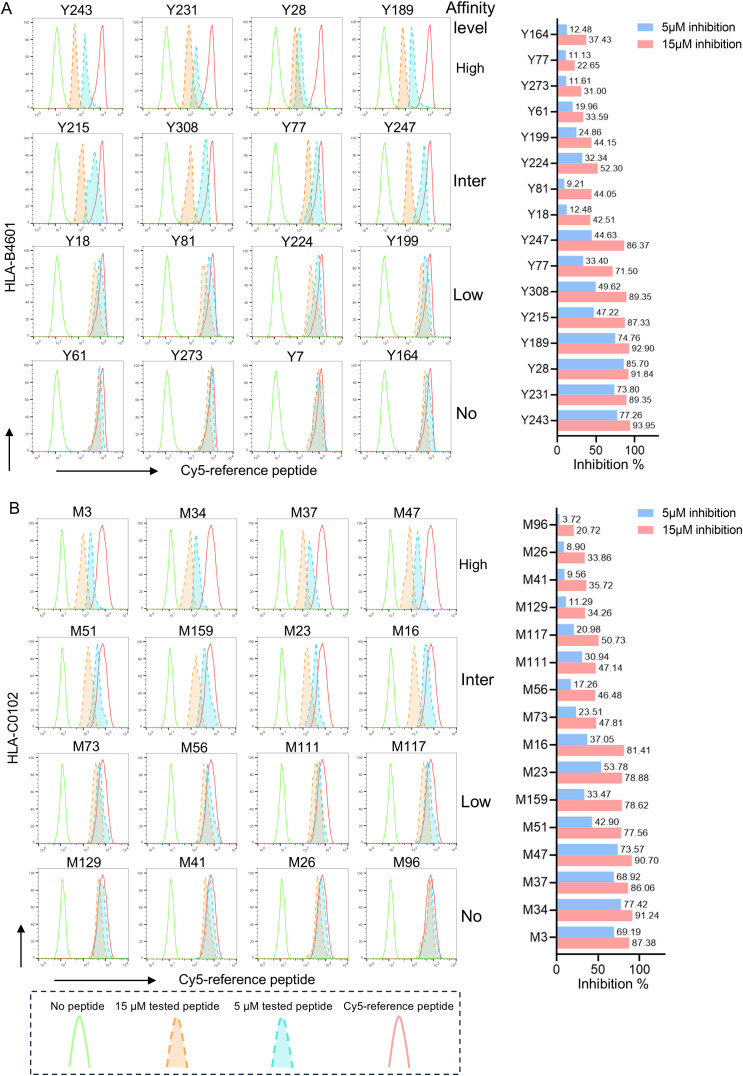
Since the outbreak of novel coronavirus pneumonia (COVID-19), numerous T-cell epitopes in severe acute respiratory syndrome coronavirus 2 (SARS-CoV-2) proteome have been reported. However, most of the identified CD8+ T-cell epitopes have been restricted primarily by HLA-A allotypes. The epitopes restricted by HLA-B and HLA-C allotypes are limited. This study focuses on the screening of T-cell epitopes restricted by 13 prevalent HLA-B and 13 prevalent HLA-C allotypes, which cover over 70% and 90% of the Chinese and Northeast Asian populations, respectively. Totally, 67 HLA-B restricted and 53 HLA-C restricted epitopes were validated as immunogenic epitopes with a herd predominance rate by peptide-PBMCs ex vivo coculture experiments using the PBMCs from convalescent Chinese cohort. In addition, 26 transfected cell lines expressing indicated HLA-B or HLA-C allotype were established, and used in the competitive peptide binding assays to define the affinities and cross-restriction of each validated epitope binding to HLA-B or HLA-C allotypes. These data will facilitate the design of T-cell-directed vaccines and SARS-CoV-2-specific T-cell detection tools tailored to the Northeast Asian population. The herd test of functionally validated T-cell epitopes, and the competitive peptide binding assay onto cell line array expressing prevalent HLA allotypes may serve as an additional criterion for selecting T-cell epitopes used in vaccine.
Keywords: HLA-B allotype; HLA-C allotype; SARS-CoV-2; T-cell epitope; vaccine.
Copyright © 2025 Zhao, Peng, He, Li, Han, Fu, Wu, Yue, Yan, Zhao and Shen.
Conflict of interest statement
The authors declare that the research was conducted in the absence of any commercial or financial relationships that could be construed as a potential conflict of interest.
Figures
Similar articles
-
Screening HLA-A-restricted T cell epitopes of SARS-CoV-2 and the induction of CD8+ T cell responses in HLA-A transgenic mice.Cell Mol Immunol. 2021 Dec;18(12):2588-2608. doi: 10.1038/s41423-021-00784-8. Epub 2021 Nov 2. Cell Mol Immunol. 2021. PMID: 34728796 Free PMC article.
-
Large-Scale Screening of CD4+ T-Cell Epitopes From SARS-CoV-2 Proteins and the Universal Detection of SARS-CoV-2 Specific T Cells for Northeast Asian Population.J Med Virol. 2025 Feb;97(2):e70241. doi: 10.1002/jmv.70241. J Med Virol. 2025. PMID: 39977358
-
COVID-19 coronavirus vaccine T cell epitope prediction analysis based on distributions of HLA class I loci (HLA-A, -B, -C) across global populations.Hum Vaccin Immunother. 2021 Apr 3;17(4):1097-1108. doi: 10.1080/21645515.2020.1823777. Epub 2020 Nov 11. Hum Vaccin Immunother. 2021. PMID: 33175614 Free PMC article.
-
A systemic review of T-cell epitopes defined from the proteome of SARS-CoV-2.Virus Res. 2023 Jan 15;324:199024. doi: 10.1016/j.virusres.2022.199024. Epub 2022 Dec 13. Virus Res. 2023. PMID: 36526016 Free PMC article.
-
Degenerate CD8 Epitopes Mapping to Structurally Constrained Regions of the Spike Protein: A T Cell-Based Way-Out From the SARS-CoV-2 Variants Storm.Front Immunol. 2021 Sep 8;12:730051. doi: 10.3389/fimmu.2021.730051. eCollection 2021. Front Immunol. 2021. PMID: 34566990 Free PMC article. Review.
References
MeSH terms
Substances
LinkOut - more resources
Full Text Sources
Medical
Molecular Biology Databases
Research Materials
Miscellaneous