. 2025 May 21:16:1487007.
doi: 10.3389/fendo.2025.1487007. eCollection 2025.

MAPK8 and HDAC6: potential biomarkers related to autophagy in diabetic retinopathy based on bioinformatics analysis

Affiliations

MAPK8 and HDAC6: potential biomarkers related to autophagy in diabetic retinopathy based on bioinformatics analysis

Ruotong Sun et al. Front Endocrinol (Lausanne). .

Abstract

Introduction: One of the most common vascular diseases of the retina is diabetic retinopathy (DR), a microvascular condition caused by diabetes. The autophagy system transports and degrades cytoplasmic substances to lysosomes as part of the intracellular degradation process. Autophagy appears to be an important regulator in the development and progression of DR, but its mechanism and potential role are unclear. The purpose of this study is to identify autophagy-related genes in DR and find potential biomarkers associated with DR through bioinformatics analysis.

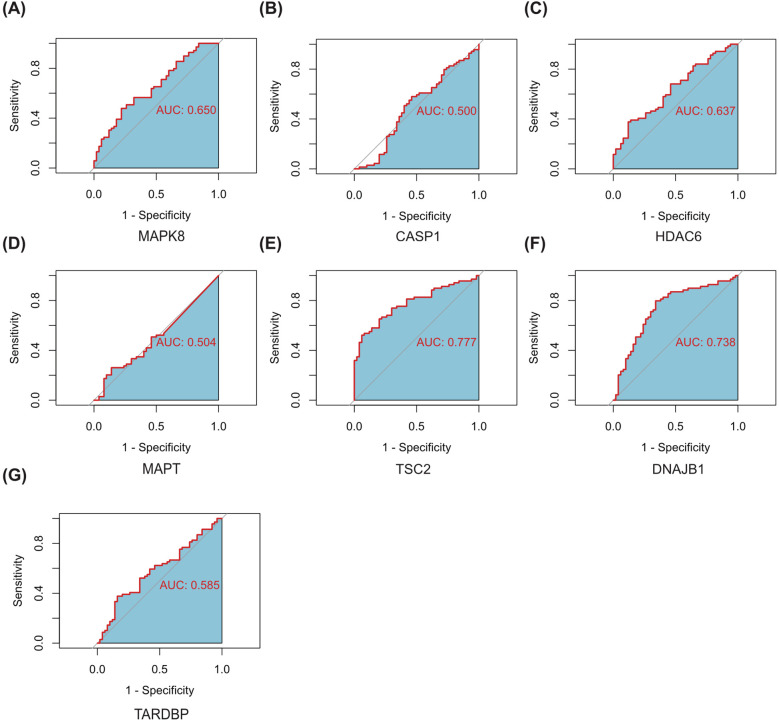
Method: We retrieved the dataset GSE102485 from the Gene Expression Omnibus (GEO) database and compiled a list of 344 autophagy-related genes. Using the R software, bioinformatics analysis was used to identify the differentially expressed autophagy-related genes (ARGs). Then, we identified the autophagy-related hub genes (ARHGs) through a series of analyses including Gene Ontology (GO) enrichment analysis, Kyoto Encyclopedia of Genes and Genomes (KEGG) pathway analysis, correlation analysis, and protein-protein interaction (PPI) network. In addition, the miRNA-gene-TF interaction network was generated using the NetworkAnalyst platform. Potential therapeutic drugs were predicted utilizing the Drug-Gene Interaction Database (DGIdb). Ultimately, DR was simulated through the high glucose incubation of the retinal pigment epithelium cell line (ARPE-19), and employing quantitative real-time polymerase chain reaction (qRT-PCR) to verify ARHG expression. The effectiveness of ARHGs in diagnosing DR was assessed by measuring the area under the receiver operating characteristic (ROC) curve.

Results: Differential expression analysis identified 26 ARGs, of which 6 were upregulated and 20 were downregulated. Through GO and KEGG enrichment analysis, it was found that ARGs showed significant enrichment in autophagy-related pathways. Using PPI network analysis, 7 ARHGs were identified. The expression of MAPK8, HDAC6, DNAJB1 and TARDBP, in a model of DR were confirmed by qRT-PCR. The ROC curve results showed that MAPK8, HDAC6, DNAJB1 and TSC2 had high predictive accuracy and could be used as biomarkers for DR.

Conclusion: Through bioinformatics analysis, we identified 26 genes that may be associated with autophagy in DR. We suggest that the hub genes MAPK8 and HDAC6 as biomarkers may be involved in autophagy in DR.

Keywords: HDAC6; MAPK8; autophagy; biomarker; diabetic retinopathy.


Conflict of interest statement

The authors declare that the research was conducted in the absence of any commercial or financial relationships that could be construed as a potential conflict of interest.

Figures

Figure 1
Figure 1
Overview of the research procedure of this study.
Figure 2
Figure 2
Identification of differentially expressed genes involved in autophagy in DRof GSE102485. (A) Volcano plot of 2256 differentially expressed genes in the GSE102485 dataset. It contains 2211 significantly up-regulated genes, represented by red dots, and 2045 significantly down-regulated genes, represented by blue dots, whereas gray dots represent stably expressed genes. (B) Heatmap of the top 50 significantly differentially expressed genes in the GSE102485 dataset. The blue bars represent control specimen, denoted by “Control”, and the red bars represent specimens from patients with DR, denoted by “DR”. (C) Venn showing 26 common genes between differentially expressed genes and autophagy-related genes. (D, E) 26 differentially expressed autophagy-related genes correlation heatmap. The color red is used to indicate a positive correlation, while the color blue is used to indicate a negative correlation.
Figure 3
Figure 3
GO and KEGG enrichment analysis of 26 differentially expressed autophagy-related genes. (A) Bar plot of enriched GO terms. (B) Bubble plot of enriched GO terms. (C) Eight Diagrams of enriched GO terms. (D) Common genes in the most top enriched pathways. (E) Bar plot of enriched KEGG terms. GO, Gene Ontology; BPs, biological processes; CCs, cellular components; MFs, molecular function. KEGG, Kyoto Encyclopedia of Genes and Genomes.
Figure 4
Figure 4
The protein-protein interaction network of 26 differentially expressed autophagy-related genes. (A) The PPI network of 26 differentially expressed ARGs was constructed by using String database. It contains 25 nodes and 52 edges. The average node degree is 4.16, and the PPI enrichment P-value is less than 3.68e-12. (B) The PPI network processed with CytoScape software consists of 26 ARGs. Blue represents downregulated genes, and red represents upregulated genes. Rhombic shape represents the hub genes; ellipse represents others. PPI,protein-protein interaction; ARGs, differentially expressed autophagy-related genes.
Figure 5
Figure 5
Identification and correlation analysis of hub genes. (A-D) The top 10 hub genes were identified through the protein-protein interaction network map using four algorithms: maximal clique centrality (MCC), maximal neighborhood centrality (MNC), degree, and density-based maximal clique (DMNC). (E) Venn shows 7 autophagy-related hub genes (ARHGs) obtained by four algorithms. (F) Chord diagram of 7 ARHGs. Red represents positive correlation, blue represents negative correlation, and the darker the color or the thicker the line, the higher the correlation intensity.MCC, maximal clique centrality; MNC, maximal neighborhood centrality; DMNC, density-based maximal clique; ARHGs, autophagy-related hub genes.
Figure 6
Figure 6
Network of miRNAs-genes-TFs interacting with hub genes. Rectangles represents miRNAs; Diamond shape represents TFs; Circles represents hub genes.
Figure 7
Figure 7
qRT-PCR experiment to verify the expression of 7 autophagy related hub genes of interest in the in ARPE-19 cells. P-values were calculated using Student’s t-test. **P < 0.01; ***P < 0.001; ns, non-significant. Blue bars represent the control group, denoted by “CON”, and red bars represent the DR group, denoted by “DR”. qRT-PCR, quantitative real-time polymerase chain reaction; ARPE-19, retinal pigment epithelial cell line.
Figure 8
Figure 8
ROC curves of the 7 autophagy-related hub genes for the diagnosis when distinguishing DR from normal (A–G). AUC, Area Under Curve.

Similar articles

References

    1. Cheung N, Mitchell P, Wong TY. Diabetic retinopathy. Lancet. (2010) 376:124–36. doi: 10.1016/s0140-6736(09)62124-3 - DOI - PubMed
    1. Tan TE, Wong TY. Diabetic retinopathy: looking forward to 2030. Front Endocrinol (Lausanne). (2022) 13:1077669. doi: 10.3389/fendo.2022.1077669 - DOI - PMC - PubMed
    1. Wang W, Lo ACY. Diabetic retinopathy: pathophysiology and treatments. Int J Mol Sci. (2018) 19:1816–29. doi: 10.3390/ijms19061816 - DOI - PMC - PubMed
    1. Arrigo A, Aragona E, Bandello F. Vegf-targeting drugs for the treatment of retinal neovascularization in diabetic retinopathy. Ann Med. (2022) 54:1089–111. doi: 10.1080/07853890.2022.2064541 - DOI - PMC - PubMed
    1. Levine B, Kroemer G. Biological functions of autophagy genes: A disease perspective. Cell. (2019) 176:11–42. doi: 10.1016/j.cell.2018.09.048 - DOI - PMC - PubMed

MeSH terms