. 2025 Mar 28;4(3):e70023.
doi: 10.1002/imt2.70023. eCollection 2025 Jun.

Spaceflight redefines ageing-associated microbiota

Affiliations

Spaceflight redefines ageing-associated microbiota

Yuan Sun et al. Imeta. .

Abstract

Spaceflight reshapes microbiota and immune function, mitigating some ageing effects while accelerating immune aging, revealing crucial insights for astronaut health and longevity in space missions.


Conflict of interest statement

The authors declare no conflict of interest.

Figures

Figure 1
Figure 1
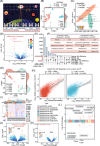
Spaceflight alters the immune function of astronauts in a manner similar to natural ageing. (A) Schematic representation depicting the experimental design and single‐cell analysis of human peripheral blood mononuclear cell (PBMC) samples. (B) Volcano plots depicting differentially expressed genes (DEGs) in major immune cell subsets related to the ageing. (C) Volcano plots depicting DEGs in major immune cell subsets related to the post‐spaceflight. (D) UpSet plots displaying the overlap and distribution of upregulated DEGs between ageing and post‐spaceflight. (E) UpSet plots displaying the overlap and distribution of downregulated DEGs between ageing and post‐spaceflight. (F) Forest plot illustrating causal effects of gut (left) and skin (right) microbiota on longevity. (G) Data collection and analytical approach of metagenomics. (H) t‐SNE plots illustrating the distribution patterns of samples for each group. (I) Principal component analysis (PCA) of gut microbiota in younger and older individuals. (J) Volcano plot depicting gut microbial alterations between younger and older individuals. The marked microbiota are the ones that show the most significant changes in the older group. Akkermansia muciniphila has been widely reported to regulate the immune system. (K) 3D volcano plot displaying microbial alterations across three different tissues between younger and older individuals.
Figure 2
Figure 2
Metagenomic and metatranscriptome data reveal common microbiota changes in the of ageing populations and spaceflight pilots. (A) Schematic overview of data collection and analytical approach. Metagenome‐wide sequencing data collected at six time points surrounding the launch, referred to as L‐92, L‐44, L‐3, R+1, R+45, and R+82, where “L” denotes prelaunch and “R” denotes return (postflight). For example, “L‐92” refers to 92 days before flight. (B) t‐SNE plots illustrating the distribution patterns of samples for each group. (C) Principal component analysis (PCA) illustrating the clustering of gut microbiota in pre‐ and postflight individuals. (D) Volcano plot depicting gut microbial alterations between pre‐ and postflight individuals. The marked microbial communities are the top three significant in the postflight individuals. Propionibacterium freudenreichii has been widely reported to regulate the immune system. (E) UpSet plot depicting the distribution of common differential gut microbiota shared between ageing individuals and postflight samples. (F) Table summarizing the common differential gut microbiota observed in both ageing and postflight samples. (G) t‐SNE plots depicting the distribution patterns of samples for each group. (H) Scatter plots illustrating the correlation between oral(left) and skin(right) metatranscriptomes and metagenomics. (I) Heatmap depicting metatranscriptome alignment results to the eggNOG database for oral microbiota. (J) Volcano plot illustrating the relative contribution to metatranscriptome alterations of oral microbiota between pre‐flight and postflight. (K) Volcano plot illustrating the relative contribution to metatranscriptome alterations of skin between pre‐flight and postflight. (L) Scatter plot indicating the species‐level differential analysis results.

References

    1. Auñón‐Chancellor, Serena M. , Pattarini James M., Moll Stephan, and Sargsyan Ashot. 2020. “Venous Thrombosis During Spaceflight.” New England Journal of Medicine 382: 89–90. 10.1056/NEJMc1905875 - DOI - PubMed
    1. Vico, Laurence , and Hargens Alan. 2018. “Skeletal Changes During and After Spaceflight.” Nature Reviews Rheumatology 14: 229–245. 10.1038/nrrheum.2018.37 - DOI - PubMed
    1. Tierney, Braden T. , Kim JangKeun, Overbey Eliah G., Ryon Krista A., Foox Jonathan, Sierra Maria A., Bhattacharya Chandrima, Damle Namita, Najjar Deena, and Park Jiwoon. 2024. “Longitudinal Multi‐Omics Analysis of Host Microbiome Architecture and Immune Responses During Short‐Term Spaceflight.” Nature Microbiology 9: 1661–1675. 10.1038/s41564-024-01635-8 - DOI - PMC - PubMed
    1. da Silveira, Willian A. , Fazelinia Hossein, Rosenthal Sara Brin, Laiakis Evagelia C., Kim Man S., Meydan Cem, Kidane Yared, et al. 2020. “Comprehensive Multi‐Omics Analysis Reveals Mitochondrial Stress as a Central Biological Hub for Spaceflight Impact.” Cell 183: 1185–1201.e20. 10.1016/j.cell.2020.11.002 - DOI - PMC - PubMed
    1. Kim, JangKeun , Tierney Braden T., Overbey Eliah G., Dantas Ezequiel, Fuentealba Matias, Park Jiwoon, Narayanan S Anand, Wu Fei, Najjar Deena, and Chin Christopher R.. 2024. “Single‐Cell Multi‐Ome and Immune Profiles of the Inspiration4 Crew Reveal Conserved, Cell‐Type, and Sex‐Specific Responses to Spaceflight.” Nature Communications 15: 4954. 10.1038/s41467-024-49211-2 - DOI - PMC - PubMed

LinkOut - more resources