. 2025 Apr 17;4(3):e70035.
doi: 10.1002/imt2.70035. eCollection 2025 Jun.

Single-microbe RNA sequencing uncovers unexplored specialized metabolic functions of keystone species in the human gut

Affiliations

Single-microbe RNA sequencing uncovers unexplored specialized metabolic functions of keystone species in the human gut

Yifei Shen et al. Imeta. .

Abstract

The human body is inhabited by trillions of microorganisms that play a crucial role in health and diseases. Our understanding of the species and functional composition of the human gut microbiome is rapidly expanding, but it is still mainly based on taxonomic profiles or gene abundance measurements. As such, little is known about the species-function heterogeneity and dynamic activities in human microecosystem niches. By applying a novel gut-specific single-microbe ribonucleic acid (RNA) sequencing and analytical framework on three healthy donors with distinct enterotypes, we created a comprehensive transcriptional landscape of the human gut microbiome and dissected functional specialization in 38,922 single microbes across 198 species. We investigated the functional redundancy and complementarity involved in short-chain fatty acids related central carbon metabolism and studied the heterogeneity and covariation of single-microbe metabolic capacity. Comparing the human gut microbiome at different times throughout the day, we were able to map diurnal dynamic activities of the gut microbiome and discovered its association with sub-population functional heterogeneous. Remarkably, using single-microbe RNA sequencing, we systematically dissected the metabolic function heterogeneity of Megamonas funiformis, a keystone species in Asian populations. Together with in vitro and in vivo experimental validations, we proved M. funiformis can effectively improve mineral absorption through exogenous phytic acid degradation, which could potentially serve as a probiotic that reduces malnutrition caused by deficiency of mineral elements. Our results indicated that species-function heterogeneity widely exists and plays important roles in the human gut microbiome, and through single-microbe RNA sequencing, we have been able to capture the transcriptional activity variances and identify keystone species with specialized metabolic functions of possible biological and clinical importance.

Keywords: diurnal dynamic; gut microbiome; metabolism; single‐microbe RNA sequencing; species functional heterogeneity.


Conflict of interest statement

Yongcheng Wang is a cofounder, and Jiong Liu is a cofounder and employee of M20 Genomics. The other authors declare no competing interests. The result that M. funiformis metabolize phytic acid to produce acetic acid and propionic acid has been filed for patent protection by Zhejiang University.

Figures

Figure 1
Figure 1
Overview of the experiment design and single‐microbe ribonucleic acid (RNA) sequencing of the human gut microbiome. (A) Overview of the donor selection and sample collections in this study. (B) Workflow of single‐microbe RNA sequencing in human gut microbiome. (C) Integrated analysis framework of single‐microbe RNA sequencing data. (D) Characterized species‐function heterogeneity, diurnal dynamic activities and microbe cellular fates transitions. (E) Experimental verification of the key specialized function species (Megamonas funiformis). ET‐B, Enterotype‐Bacteroides; ET‐F, Enterotype‐Firmicutes; ET‐P, Enterotype‐Prevotella; SCFA, short‐chain fatty acids; TP1, Time point 1; TP2, Time Point 2; TP3, Time point 3.
Figure 2
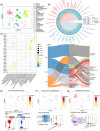
Figure 2
Single‐microbe transcriptional landscape of the human gut and the species‐specific functional characterizations. (A) Uniform manifold approximation and projection (UMAP) of the gut microbes with taxonomic annotation colored by species. (B) Phylogenetic tree plot showing the taxonomic proportion of the gut microbes from nine samples in the three donors. (C) Dot plot showing the functional marker genes in each species. (D) Sankey plot showing the function of species‐specific marker genes in three donors. (E) UMAP color by the gene aprA (marker of Desulfovibrio piger) expression level, violin plot showed the expression level of genes (aprA and dsrB) in sulfur metabolism, the pathway diagram illustrates the function of the genes in the “Dissimilatory sulfite reduction.” (F) UMAP color by the gene hag (marker of CAG‐81 sp900066535) expression level, violin plot showed the expression level of gene hag (flagellin), which related with microbe motility. (G) UMAP color by the gene sodB (marker of Bacteroides dorei) expression level, violin plot showed the expression level of gene sodB (superoxide dismutase), which catalyzes the conversion of superoxide radicals to oxygen and hydrogen peroxide, protecting cells from the toxic byproducts of aerobic respiration. ET‐B, Enterotype‐Bacteroides; ET‐F, Enterotype‐Firmicutes; ET‐P, Enterotype‐Prevotella; FeSOD, iron superoxide dismutase; ROS, reactive oxygen species; TP1, Time point 1; TP2, Time Point 2; TP3, Time point 3; UMAP, uniform manifold approximation and projection.
Figure 3
Figure 3
Functional redundancy and complementarity of short‐chain fatty acids (SCFAs) related central carbon metabolism. (A) Heatmap showing the expression level of the genes involved in carbohydrate metabolism. The species within the sample phylum were ordered according to the barcode number. The transcripts per million (TPM) of each species was calculated as following: TPM = (reads/mean detected reads of species) *1,000,000. The pathway diagram shows the galactose metabolism, starch and sucrose metabolism and pyruvate metabolism respectively (B), glycolysis (C), pentose phosphate pathway (PPP) (D) and tricarboxylic acid (TCA) cycle (E). In the context of the human gut microbiome, primary degraders (first trophic level) with specialized machinery hydrolyze complex polysaccharides, releasing sugars accessible to other species. Primary fermenters (second trophic level) either liberate these sugars or acquire them from other microbes, funneling them through glycolysis to produce phosphoenolpyruvate (PEP), which is used for substrate‐level phosphorylation to generate organic acids (e.g., formate, acetate, succinate) or alcohols. Secondary fermenters (third trophic level) use these by‐products to produce SCFAs that affect mucosal and systemic immune responses [27]. PP pathway, pentose phosphate pathway; SCFA, short‐chain fatty acids; TCA cycle, tricarboxylic acid cycle; TPM, transcripts per million.
Figure 4
Figure 4
Heterogeneity and covariations of single‐microbe metabolic functions in the human gut. (A) A brief introduction to Microbe‐Metabolism (MIC‐Metabolism). (B) Computational workflow of MIC‐Metabolism. (C) The activated pathway number of the dominant species from the three donors. (D) Heatmap showing the ranked‐based metabolic enrichment score (MES) of the gut microbe species in metabolic‐related pathways. (E) The UMAP colored by the MES of pyruvate metabolism, the boxplot shows the comparison of MES between M. funiformis and other microbe species. (F) The UMAP colored by the MES of propanoate metabolism, the boxplot shows the comparison of MES between B. dorei and other microbe species. The boxplot shows the comparisons of MES of B. dorei (G) and M. funiformis (H) in different donors. Correlation analysis of MES for the dominant species of ET‐P donor (I) and ET‐F donor (J), the correlation between M. funiformis and P. timonensis (I), B. dorei and Enterocloster sp000431375 (J), the dots were colored by the function category of the pathways. *p < 0.05, **p < 0.01, ***p < 0.001. ET‐B, Enterotype‐Bacteroides; ET‐F, Enterotype‐Firmicutes; ET‐P, Enterotype‐Prevotella; smRNA‐seq, single‐microbe RNA sequencing; UMAP, uniform manifold approximation and projection.
Figure 5
Figure 5
Single‐microbe RNA sequencing captures the diurnal dynamic activities of the human gut microbiome. (A) UMAP color by species (left) and time point (right) of the three donors, the significance was determined by the analysis of similarities (ANOSIM). (B) Heatmap showing the number of time‐point marker gene in the dominant species of the three donors, the bar plot (left) showed the proportion of time‐specific marker genes among all genes of each donor, the bar plot (right) showed the proportion of time marker genes among species marker genes. (C) Sankey plot showing the function of the time‐specific marker genes in the three donors. (D) Comparison of MES on TCA cycle, glycolysis and pyruvate metabolism of different species in the three donors across three‐time points. (E) Correlation of the dominant species from ET‐P donor across different metabolic pathways. The line color purple indicates a positive correlation, while yellow indicates a negative correlation. The thickness of the lines represents the magnitude of the correlation coefficient, and the size of the dots represents the MES of species. (F) UMAP plot showed three clusters (subpopulations) of P. copri from ET‐P donor under 0.5 resolution of Seurat package; Dot plot showed the marker genes of each subpopulation; Boxplot showing the MES of specific pathways of each subpopulation; Ballon plot showed the barcode number of each subpopulation and each time point. (G) UMAP plot showing five clusters (sub‐populations) of B. dorei from ET‐B donor under 0.5 resolution of Seurat package; Dot plot showing the marker genes of each subpopulation; Boxplot showed the MES of specific pathways of each subpopulation; Ballon plot showing the barcode number of each subpopulation and each time point. *p < 0.05, **p < 0.01, ***p < 0.001. ET‐B, Enterotype‐Bacteroides; ET‐F, Enterotype‐Firmicutes; ET‐P, Enterotype‐Prevotella; MES, metabolic enrichment score; TCA cycle, tricarboxylic acid cycle; TP1, Time point 1; TP2, Time Point 2; TP3, Time point 3; UMAP, uniform manifold approximation and projection.
Figure 6
Figure 6
Functional trajectory analysis uncovering M. funiformis's state transitions in distinct colon ecosystems. (A) UMAP clustering identified seven clusters (sub‐populations) of M. funiformis from ET‐P and ET‐F donor under 0.5 resolution of Seurat package. Bar plot showed the contributions of different donors (left) and time points (right) of different clusters. (B) Dot plot showed the marker genes of each cluster. (C) Heatmap showing the MES of different pathways across each cluster. (D) Diagram of inositol phosphate metabolism. (E) UMAP colored by MES of inositol phosphate metabolism, the boxplot showing the comparison of MES on inositol phosphate metabolism of each cluster. (F) Pseudo‐time analysis of M. funiformis. (G) Differential expressed genes from pseudo‐time analysis. The heatmap shows the time series of gene expression. The bar plot shows the numbers of differential genes per trajectories in the Kyoto Encyclopedia of Genes and Genomes (KEGG) pathways. (H) The underlying mechanism of cell fate transitions within distinct colon ecosystems. ET‐B, Enterotype‐Bacteroides; ET‐F, Enterotype‐Firmicutes; ET‐P, Enterotype‐Prevotella; MES, metabolic enrichment score; TP1, Time point 1; TP2, Time Point 2; TP3, Time point 3; UMAP, uniform manifold approximation and projection.
Figure 7
Figure 7
M. funiformis improve mineral absorption through exogenous phytic acid degradation. (A) The experimental design of in vitro M. funiformis phytic acid conversion. (B) The growth curve of M. funiformis at different culture conditions. (C) Bar plot showing the expression level of iolE, iolD, dnaK and htpG of M. funiformis in different conditions. (D) Line chart showing the phytic acid concentration in phytic acid group at different growth phases. (E) Line chart showing the acetic acid, propionic acid and butyric acid concentration in phytic acid group at different growth phases. (F) The experimental design of in vivo M. funiformis phytic acid conversion (n = 8). (G) Boxplot showing the serum mineral elements concentration in the different treatment groups. (H) Bar plot showing the phytic acid concentration in the different treatment groups. (I) Violin plot showing the acetic acid, propionic acid and butyric acid concentration in the different treatment groups. (J) Overview of the effect of phytic acid on mineral absorption and degradation by M. funiformis in gut. NC, mice treated with 0.85% NaCl; PA, mice treated with phytic acid; PA_MF, mice treated with phytic acid and M. funiformis. *p < 0.05, **p < 0.01, ***p < 0.001, NS, not significant. Ca, calcium; Cu, copper; Fe, iron; Mg, magnesium; Mn, manganese; SCFA, short‐chain fatty acids; Zn, zinc.

Similar articles

References

    1. Rackaityte, Elze , and Lynch Susan V.. 2020. “The Human Microbiome in the 21st Century.” Nature Communications 11: 5256. 10.1038/s41467-020-18983-8 - DOI - PMC - PubMed
    1. Mann, Elizabeth R. , Lam Ying Ka, and Uhlig Holm H.. 2024. “Short‐Chain Fatty Acids: Linking Diet, the Microbiome and Immunity.” Nature Reviews Immunology 24: 577–595. 10.1038/s41577-024-01014-8 - DOI - PubMed
    1. Vieira‐Silva, Sara , Falony Gwen, Darzi Youssef, Lima‐Mendez Gipsi, Garcia Yunta Roberto, Okuda Shujiro, Vandeputte Doris, et al. 2016. “Species–Function Relationships Shape Ecological Properties of the Human Gut Microbiome.” Nature Microbiology 1: 16088. 10.1038/nmicrobiol.2016.88 - DOI - PubMed
    1. Xu, Meng‐Qi , Pan Fei, Peng Li‐Hua, and Yang Yun‐Sheng. 2024. “Advances in the Isolation, Cultivation, and Identification of Gut Microbes.” Military Medical Research 11: 34. 10.1186/s40779-024-00534-7 - DOI - PMC - PubMed
    1. Lai, Senying , Yan Yan, Pu Yanni, Lin Shuchun, Qiu Jian‐Ge, Jiang Bing‐Hua, Keller Marisa Isabell, et al. 2023. “Enterotypes of the Human Gut Mycobiome.” Microbiome 11: 179. 10.1186/s40168-023-01586-y - DOI - PMC - PubMed

LinkOut - more resources