. 2025 Apr 19;4(3):e70040.
doi: 10.1002/imt2.70040. eCollection 2025 Jun.

Gut microbiota-derived butyrate mediates the anticolitic effect of indigo supplementation through regulating CD4+ T cell differentiation

Affiliations

Gut microbiota-derived butyrate mediates the anticolitic effect of indigo supplementation through regulating CD4+ T cell differentiation

Yunqi Xing et al. Imeta. .

Abstract

This study explored the effect of plant-derived indigo supplementation on intestinal inflammation using in vivo, in vitro, and clinical sample analyses. Our results showed that indigo decreased mucosal inflammation by regulating CD4+ T cell differentiation in a gut microbiota-dependent manner. Microbes transferred from indigo-treated mice, indigo-induced enrichment of Roseburia intestinalis, and its metabolite butyrate played a role in Th17/Treg immunity similar to that of indigo in intestinal inflammation, which was involved in mTORC1/HIF-1α signal-mediated reprogrammed glucose metabolism. We further showed that patients with ulcerative colitis exhibited significant gut dysbiosis and CD4+ T cell differentiation abnormalities. Our findings provide new insights into the gut-immune axis in ulcerative colitis, offering a novel microbial-based immunotherapy for the treatment of inflammatory bowel disease.


Conflict of interest statement

The authors declare no conflicts of interest.

Figures
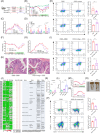
Figure 1
Figure 1
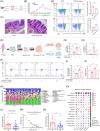
Indigo alleviates intestinal inflammation by regulating Th17/Treg balance in a gut microbiota‐dependent manner. C57BL/6 mice had free access to sterile water containing 2.5% DSS for 1 week to induce colitis, followed by 7 days of intragastric administration of indigo suspension at a dose of 60 mg/kg and 300 mg/kg or PBS; mesenteric lymph nodes (MLNs) from mice were collected, and the percentages of Th17 and Treg cells were analyzed. (A) Experimental schematic of the pharmacodynamic of indigo. (B) Body weight. (C) Disease activity index (DAI) score. (D) Corresponding histopathological scores of colon tissues. (E) Representative plots and bar charts of the percentage of CD4+ IL17+ (Th17) and CD4+ FOXP3+ (Treg) cells in MLNs. Fecal material (stool pellets, and cecal and colonic contents) from donor mice were collected and orally gavaged to the corresponding recipients. Clinical status was assessed throughout the experiment, and MLNs and colon from each mouse were collected for flow analysis and RT‐qPCR. (F) Body weight change. (G) DAI score. (H) Representative H&E staining. (I) CD4+ IL17+ cells (Th17s) and CD4+ FOXP3+ cells (Tregs) in MLNs were analyzed by flow cytometry, and the results were displayed as bar charts. Fecal samples from all mice were collected for microbiome profile analysis using bacterial 16S rRNA gene sequencing analysis. (J) Heatmap of abundant OTUs at the species, genus, family, and phylum levels in each group. (K) Relative abundance of Roseburia from 16S rRNA gene sequencing analysis. (L) In vitro bacterial cultures of R. intestinalis with indigo treatment showed that indigo has a direct and significant growth‐promoting effect on the growth of R. intestinalis at 72 h. C57BL/6 mice were administered 2.5% DSS for 1 week, followed by 1 × 109 CFU Roseburia intestinalis suspended in 150 μL or PBS per day for 7 days, after which the growth performance and the severity of colitis of all mice were evaluated. (M) Body weight change. (N) DAI score. (O) Colonic morphology. (P) Th17s and Tregs in MLNs were analyzed by flow cytometry, and the results were displayed as bar charts. All data are presented as means ± SEM (n = 4–6 per group) from one of three experiments performed showing similar results. ANOVA followed by Tukey's multiple comparison test for B, C, F, G, M, N; Kruskal–Wallis test followed by Dunn's multiple comparisons test for D, K, L; Student's t‐test for E (Tregs), P; and Mann–Whitney U test for E (Th17s), I. ## p < 0.01, # p < 0.05 versus the Control group; ∗∗p < 0.01, ∗p < 0.05 versus the DSS group; n.s., not significant.
Figure 2
Figure 2
Gut microbiota‐derived butyrate regulates the differentiation of naïve CD4+ T cells in vivo and in vitro. To investigate the effect of butyrate on colitis in vivo, C57BL/6 mice were administered 2.5% DSS for 1 week, followed by 200 mM butyrate in drinking water, and the clinical phenotypes and the severity of colitis were assessed throughout the experiment. (A) Experimental schematic. (B) DAI score. (C) H&E staining (40× and 200× magnification) of colon tissues. MLNs from each mouse were collected for flow analysis. (D) Th17s and Tregs in MLNs from each group were analyzed by flow cytometry, and the results were displayed as bar charts. All data are presented as means ± SEM (n = 4–6 per group) from one of three experiments performed showing similar results. ## p < 0.01, # p < 0.05 versus the Control group; ∗∗p < 0.01, ∗p < 0.05 versus the DSS group. (E, F) The differentiation of naïve CD4+ T cells into Th17 cells in the presence or absence of butyrate or mTORC1 agonist l‐leucine by flow cytometry. (G, H) The mRNA levels of Glut1 and HK2 in Th17‐polarizing CD4+ T cells were analyzed by RT‐qPCR. (I, J) The level of glucose in Th17‐cell lysate and lactate in supernatants were determined by spectrophotometer. All data are presented as mean ± SEM (n = 4 per group) from one of three experiments performed showing similar results. Human fecal specimens were collected from 24 healthy volunteers and 22 ulcerative colitis patients for bacterial 16S rRNA sequencing analysis, and all data are presented as mean ± SEM. (K) The composition of the bacterial microbiota in different groups at genus level. (L) The relative abundance of Roseburia was analyzed. (M) Spearman correlation analyses between the relative abundance of genus Roseburia and modified Mayo score in UC patients. (N) Human fecal specimens were collected for butyrate analysis by gas chromatography coupled with mass spectrometry. (O) Spearman correlation analyses between the relative abundance of the top 15 genera and Th17, Treg cell, or SCFAs levels in UC patients. ANOVA followed by Tukey's multiple comparison's test for B, J; Brown–Forsythe or Welch ANOVA tests for G, I; Kruskal–Wallis test followed by Dunn's multiple comparisons test for E; Student's t‐test for D (Tregs); and Mann–Whitney U test for D (Th17s), L, N. ∗∗p < 0.01, ∗p < 0.05 versus the HV group; n.s., not significant.

References

    1. Wangchuk, Phurpa , Yeshi Karma, and Loukas Alex. 2024. “Ulcerative Colitis: Clinical Biomarkers, Therapeutic Targets, and Emerging Treatments.” Trends in Pharmacological Sciences 45: 892–903. 10.1016/j.tips.2024.08.003 - DOI - PubMed
    1. D'Amico, Ferdinando , Peyrin‐Biroulet Laurent, and Danese Silvio. 2023. “Disease Clearance in Ulcerative Colitis: Is the Ultimate Therapeutic Target?” United European Gastroenterology Journal 11: 717–719. 10.1002/ueg2.12436 - DOI - PMC - PubMed
    1. Feuerstein, Joseph D. , Moss Alan C., and Farraye Francis A.. 2019. “Ulcerative Colitis.” Mayo Clinic Proceedings 94: 1357–1373. 10.1016/j.mayocp.2019.01.018 - DOI - PubMed
    1. Weingarden, Alexa R. , and Vaughn Byron P.. 2017. “Intestinal Microbiota, Fecal Microbiota Transplantation, and Inflammatory Bowel Disease.” Gut Microbes 8: 238–252. 10.1080/19490976.2017.1290757 - DOI - PMC - PubMed
    1. Zmora, Niv , Suez Jotham, and Elinav Eran. 2019. “You Are What You Eat: Diet, Health and the Gut Microbiota.” Nature Reviews Gastroenterology & Hepatology 16: 35–56. 10.1038/s41575-018-0061-2 - DOI - PubMed

LinkOut - more resources