Review
. 2025 May 17;3(1):qyaf066.
doi: 10.1093/ehjimp/qyaf066. eCollection 2025 Jan.

Cardiovascular imaging in 2024: review of current research and innovations

Affiliations
Review

Cardiovascular imaging in 2024: review of current research and innovations

Andrea Barison et al. Eur Heart J Imaging Methods Pract. .

Abstract

Cardiovascular imaging saw significant advancements in 2024, impacting technology, pathophysiology, and clinical applications. This review provides a comprehensive summary of the most impactful research in cardiovascular imaging published in 2024, highlighting technological advancements, as well as research on ischaemic heart disease, valvular heart disease, cardiomyopathies, and heart failure. It emphasizes the crucial role of artificial intelligence, large-scale studies, and technical improvements across echocardiography, cardiovascular magnetic resonance, computed tomography (CT), and nuclear medicine. In the context of ischaemic heart disease, non-invasive imaging strategies improve patient management and reduce invasive coronary angiograms and unnecessary follow-up testing. Computed tomography plaque characterization is a growing area of research, with potential for predicting disease severity, atherosclerosis progression, and clinical outcomes. In valvular heart disease, several imaging studies focused not only on transcatheter treatments for aortic stenosis, mitral regurgitation, and tricuspid regurgitation but also on specific conditions such as mitral valve prolapse and mitral annular disjunction. Finally, for heart failure and cardiomyopathies, imaging plays a vital role in early diagnosis and risk assessment, with newer techniques surpassing traditional methods in providing morpho-function characterization and in predicting long-term outcomes.

Keywords: cardiovascular magnetic resonance; computed tomography; echocardiography; multimodality imaging; positron emission tomography; single photon emission tomography.


Conflict of interest statement

Conflict of interest: G.P. received honorarium as speaker/consultant and institutional research grant from GE Healthcare, Bracco, Heartflow, Novartis, Alexion, Menarini. All other authors have nothing to disclose.

Figures

Graphical Abstract
Graphical Abstract
The most recent advancements of cardiovascular imaging are represented, including both technological novelties for each modality (top row) and pathophysiological and clinical applications (bottom row). ACS, acute coronary syndrome; AI, artificial intelligence; CAD, coronary artery disease; CMR, cardiovascular magnetic resonance; CT, computed tomography; DCM, dilated cardiomyopathy; HCM, hypertrophic cardiomyopathy; LA, left atrium; LGE, late gadolinium enhancement; LV, left ventricle; MACE, major adverse cardiovascular event; MPI, myocardial perfusion imaging; MR, mitral regurgitation; MRI, magnetic resonance imaging; NDLVC, non-dilated left ventricular cardiomyopathy; PCI, percutaneous coronary intervention; PET, positron emission tomography; RV, right ventricle; SPECT, single photon emission computed tomography; TEER, transcatheter-edge-to-edge repair; TR, tricuspid regurgitation.
Figure 1
Figure 1
Cardiovascular imaging in ischaemic heart disease (IHD). The most important novelties of current imaging techniques in the clinical management of IHD are schematically indicated in the figure. AI, artificial intelligence; CCTA, coronary computed tomography angiography; CMR, cardiovascular magnetic resonance; CT, computed tomography; FAI, fat attenuation index; FDG, fluorodeoxyglucose; ICA, invasive coronary angiography; LV, left ventricle; MACE, major adverse cardiovascular events; MBF, myocardial blood flow; MI, myocardial infarction; MRI, magnetic resonance imaging; PCAT, pericoronary adipose tissue; PET, positron emission tomography.
Figure 2
Figure 2
Cardiovascular imaging in valvular heart disease. The most important novelties of current imaging techniques in the clinical management of valvular heart are schematically indicated in the figure. AS, aortic stenosis; GLS, global longitudinal strain; LA, left atrium; LV, left ventricle; MAD, mitral annular disjunction; SAVR, surgical aortic valve replacement; STREI, speckle tracking echocardiography; TAVR, transcatheter aortic valve replacement; TEE, transoesophageal echocardiography; TEER, transcatheter-edge-to-edge repair; TR, tricuspid regurgitation.
Figure 3
Figure 3
Cardiovascular imaging in cardiomyopathies and heart failure. The most important advantages and the most recent advancements of each technique are schematically indicated in the figure. AL, light chain amyloidosis; ASR, apical sparing ratio; ATTR, transthyretin amyloidosis; CMR, cardiovascular magnetic resonance; DCM, dilated cardiomyopathy; HCM, hypertrophic cardiomyopathy; HF, heart failure; LA, left atrium; LGE, late gadolinium enhancement; LV, left ventricle; LVEF, left ventricular ejection fraction; MR, mitral regurgitation; MRI, magnetic resonance imaging; NDLVC, non-dilated left ventricular cardiomyopathy; RV, right ventricle; SCD, sudden cardiac death; TR, tricuspid regurgitation.
Figure 4
Figure 4
Example of left ventricular global longitudinal strain calculation in a 47-year-old person by using a manual method (A), a semi-automated method (B), and a fully automated artificial intelligence (AI) method (C). Reproduced from Sveric KM et al.
Figure 5
Figure 5
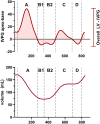
Apex-to-base LV-IVPG time curve analysis. Demonstration of the apex-to-base LV-IVPGs (dimensionless, y-axis) during one cardiac cycle (in ms, x-axis), with corresponding volume curve below (in mL on y-axis and ms on x-axis). In this time curve, five distinct phases can be distinguished. First, the positive vector ‘A’ represents the systolic ejection phase. Second, the negative vector ‘B’ represents the systolic-diastolic transition, including the end-systolic LV contraction slow down phase and aortic valve closure ‘B1’, followed by the opening of the mitral valve and diastolic suction ‘B2’. Fourth, the positive vector ‘C’ represents the passive filling phase. Fifth, the negative vector ‘D’ represents the left atrial contraction in late diastole. The area under the curve represents the overall apex-to-base LV-IVPG. LV-IVPG, left ventricular intraventricular pressure gradients. Reproduced from Konijnenberg LSF et al.
Figure 6
Figure 6
Accurate fully automated assessment of left ventricle, left atrium, and left atrial appendage function from computed tomography using deep learning (U-Net is a convolutional neural network commonly used for medical image segmentation). Reproduced from Jollans L et al.

References

    1. Yafasov M, Olsen FJ, Skaarup KG, Højbjerg Lassen MC, Johansen ND, Lindgren FL et al. Normal values for left atrial strain, volume, and function derived from 3D echocardiography: the Copenhagen city heart study. Eur Heart J Cardiovasc Imaging 2024;25:602–12. - PubMed
    1. Cotella JI, Kovacs A, Addetia K, Fabian A, Asch FM, Lang RM. Three-dimensional echocardiographic evaluation of longitudinal and non-longitudinal components of right ventricular contraction: results from the world alliance of societies of echocardiography study. Eur Heart J Cardiovasc Imaging 2024;25:152–60. - PubMed
    1. Dissabandara T, Lin K, Forwood M, Sun J. Validating real-time three-dimensional echocardiography against cardiac magnetic resonance, for the determination of ventricular mass, volume and ejection fraction: a meta-analysis. Clin Res Cardiol 2024;113:367–92. - PMC - PubMed
    1. Sabo S, Dalen H, Nyberg J, Grenne BL, Jakobsen EO, Nes BM et al. Left atrial to ventricular volume ratio and relation to fitness, cardiovascular risk factors, and diastolic function in healthy individuals: the HUNT study. Eur Heart J Imaging Methods Pract 2024;2:qyae028. - PMC - PubMed
    1. Fortuni F, Biagioli P, Myagmardorj R, Mengoni A, Chua AP, Zuchi C et al. Left atrioventricular coupling index: a novel diastolic parameter to refine prognosis in heart failure. J Am Soc Echocardiogr 2024;37:1038–46. - PubMed