. 2025 Apr 1:22:41.
doi: 10.25259/Cytojournal_232_2024. eCollection 2025.

Matrix gla protein mediates CD8+ T-cell exhaustion to facilitate immune evasion in intrahepatic cholangiocarcinoma

Affiliations

Matrix gla protein mediates CD8+ T-cell exhaustion to facilitate immune evasion in intrahepatic cholangiocarcinoma

Xiaohan Cao et al. Cytojournal. .

Abstract

Objective: Matrix Gla protein (MGP) has been found to be strongly associated with cancer progression. However, its role in intrahepatic cholangiocarcinoma (ICC) remains unclear, particularly within the tumor immune microenvironment. MGP may promote immune evasion by activating the nuclear factor-kappa-light-chain-enha ncer of activated B-cells (NF-κB) signaling pathway, which increases the expression of programmed death-ligand 1 (PD-L1) and contributes to CD8+ T-cell exhaustion. This research mainly aims to examine the regulatory role of MGP in immune evasion in ICC.

Material and methods: ICC xenograft mouse models and human ICC cell line (HuCCT1) cell models were established to evaluate MGP expression patterns. MGP knockdown or overexpression in HuCCT1 cells was co-incubated with antigen-specific CD8+ T cells, and flow cytometry was used to detect markers of CD8+ T-cell exhaustion. The effects of MGP modulation on PD-L1 expression were assessed by immunohistochemistry and immunofluorescence. Western blotting was employed to analyze the impact on NF-κB signaling. In addition, MGP overexpression and p65 knockdown in HuCCT1 cells were co-transfected to study their combined effects on PD-L1 expression and CD8+ T-cell exhaustion markers. Cell proliferation and apoptosis were evaluated through colony formation assays and flow cytometry.

Results: Compared to adjacent tissues and human intrahepatic cholangiocellular epithelial cells, MGP was significantly overexpressed in ICC tumor tissues and HuCCT1 cells (P < 0.001). MGP overexpression led to NF-κB signaling phosphorylation (P < 0.001), elevated PD-L1 expression (P < 0.001), and heightened levels of CD8+ T-cell exhaustion markers (P < 0.001). Conversely, p65 knockdown mitigated the effects of MGP overexpression on HuCCT1 cell proliferation (P < 0.01) and CD8+ T-cell exhaustion (P < 0.01 and P < 0.001), while also significantly reducing PD-L1 expression (P < 0.01).

Conclusions: MGP promotes CD8+ T-cell exhaustion and facilitates immune evasion in ICC through NF-κB pathway activation.

Keywords: CD8+ T cells; Immune escape; Intrahepatic cholangiocarcinoma; Matrix Gla protein; Programmed Death-Ligand 1.


Conflict of interest statement

The authors declare no conflict of interest.

Figures

Figure 1:
Figure 1:
MGP Expression is overexpressed in ICC. (a) qRT-PCR analysis of MGP mRNA expression in ICC cells (HuCCT1) and biliary epithelial cells (BEC). (b and c) Western blot detection of MGP protein expression in HuCCT1 and BEC; (b) MGP protein bands; (c) Quantitative analysis of MGP protein gray values. n = 6. P < 0.001. MGP: Matrix gla protein, GAPDH: Glyceraldehyde-3-phosphate dehydrogenase, ICC: Intrahepatic cholangiocarcinoma, HuCCT1: ICC cells line, BEC: Biliary epithelial cells.
Figure 2:
Figure 2:
MGP triggers CD8+ T-cell impairment in co-culture using antigen-specific CD8+ T cells extracted from PBMC samples. (a) qRT–PCR validation of MGP mRNA expression efficiency in HuCCT1 cells transfected with ShRNA-MGP and MGP overexpression plasmids. (b and c) Western blot validation of MGP protein expression efficiency in HuCCT1 cells transfected with ShRNA-MGP and MGP overexpression plasmids; (b) MGP protein bands; (c) Quantitative analysis of MGP protein gray values. (d-k) Cells transfected with ShRNA-MGP and MGP overexpression plasmids in HuCCT1, co-cultured with antigen-specific CD8+ T cells, as well as the expressions of LAG3, PD1, TIGIT, and TIM3, were analyzed by flow cytometry. n = 6. P < 0.05, P < 0.001. MGP: Matrix Gla Protein, GAPDH: Glyceraldehyde-3-phosphate dehydrogenase, Sh-NC: ShRNA-Negative control, Sh-MGP: ShRNA-Matrix Gla Protein, Ov-NC: Overexpression-Negative control, Ov-MGP: Overexpression-Matrix Gla Protein, LAG3: Lymphocyte-activation gene 3, PD1: Programmed cell death protein 1, TIGIT: T-cell immunoreceptor with Ig and ITIM domains, TIM3: T-cell immunoglobulin and mucin domain 3.
Figure 3:
Figure 3:
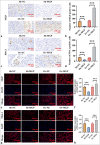
MGP Upregulates PD-L1 Expression in ICC. (a and b) IHC detection of MGP protein expression in ICC tumor tissues after MGP knockdown or overexpression. (a) IHC images, scale bar:100 μm, 200× of MGP; (b) Quantitative analysis of MGP expression levels; (c and d) Immunohistochemical detection of PD-L1 protein expression in ICC tumor tissues after MGP knockdown or overexpression; (c) IHC images, scale bar:100 μm, 200× of PD-L1; (d) Quantitative analysis of PD-L1 expression levels; (e and f) Immunocytochemical detection of MGP protein expression in HuCCT1 cells after MGP knockdown or overexpression; (e) Immunocytochemical images, scale bar:100 μm, 200× of MGP; (f) Quantitative analysis of MGP expression levels; (g and h) Immunocytochemical detection of PD-L1 protein expression in HuCCT1 cells after MGP knockdown or overexpression; (g) Immunocytochemical images of PD-L1; , scale bar:100 μm, 200× (h) Quantitative analysis of PD-L1 expression levels. n = 6. P < 0.001. MGP: Matrix Gla Protein, PDL1: Programmed cell death ligand 1, Sh-NC: ShRNA-Negative control, Sh-MGP: ShRNA-Matrix Gla Protein, Ov-NC: Overexpression-negative control, Ov-MGP: Overexpression-Matrix Gla Protein, DAPI: 4’,6-diamidino-2-phenylindole.
Figure 4:
Figure 4:
MGP triggered the NF-κB Pathway in ICC Cells. (a-e) Western blot analysis of protein levels of p-p65, p65, p-CREB, CREB, p-NFATC1, NFATC1, and c-MYC in HuCCT1 cells after MGP knockdown or overexpression. n = 6, P < 0.001. MGP: Matrix Gla Protein, PD-L1: Programmed cell death ligand 1, Sh-NC: ShRNA-Negative control, Sh-MGP: ShRNA-Matrix Gla Protein, Ov-NC: Overexpression-Negative control, Ov-MGP: Overexpression-matrix gla protein, p65: RelA, p-p65: Phosphorylated p65, CREB: cAMP response element-binding protein, p-CREB: Phosphorylated CREB, NFATC1: Nuclear Factor of Activated T-cells 1, p-NFATC1: Phosphorylated NFATC1, c-MYC: Cellular Myc, GAPDH: Glyceraldehyde-3-phosphate dehydrogenase.
Figure 5:
Figure 5:
NF-κB Transcription Induces PD-L1 Expression in ICC Cells. (a-e) Protein expression levels of MGP, p-p65, p65, and PD-L1 in HuCCT1 cells were assessed by Western blot following MGP overexpression or co-transfection with p65 knockdown. n = 6, P < 0.01, P < 0.001. MGP: Matrix gla protein, Ov-NC: Overexpression-negative control, Ov-MGP: Overexpression-matrix gla protein, p65: RelA, Sh-NC: ShRNA-Negative control, Sh-p65: ShRNA-p65, p-p65: Phosphorylated p65, PD-L1: Programmed cell death ligand 1, GAPDH: Glyceraldehyde-3-phosphate dehydrogenase.
Figure 6:
Figure 6:
p65 Knockdown Counteracts MGP Overexpression-Induced Cell Proliferation. (a and b) Colony formation assays evaluating cell proliferation across different groups. (c and d) EdU fluorescence staining, scale bar:100 μm, 200× assessing cell proliferation capability in each group. (e and f) TUNEL fluorescence staining, scale bar:100 μm, 200× evaluation of apoptosis levels in each group. n = 6, P < 0.01, P < 0.001. MGP: Matrix gla protein, Ov-NC: Overexpression-negative control, Ov-MGP: Overexpression-matrix gla protein, p65: RelA, Sh-NC: ShRNA-negative control, Sh-p65: ShRNA-p65, EdU: 5-Ethynyl-2’-deoxyuridine, DAPI: 4’,6-diamidino-2-phenylindole, TUNEL: Terminal deoxynucleotidyl transferase dUTP nick end labeling.
Figure 7:
Figure 7:
p65 knockdown counteracts MGP overexpression-induced antigen-specific CD8+ T-cell exhaustion. (a-h) Co-culturing of HuCCT1 cells transfected with MGP overexpression plasmids or co-transfected with p65 knockdown and antigen-specific CD8+ T cells, followed by flow cytometry measurement of common CD8+ T-cell exhaustion markers (LAG3, PD1, TIGIT, and TIM3). n = 6. P < 0.01, P < 0.001. MGP: Matrix gla protein, Ov-NC: Overexpression-negative control, Ov-MGP: Overexpression-matrix gla protein, p65: RelA, Sh-NC: ShRNA-negative control, Sh-p65: ShRNA-p65, LAG3: Lymphocyte-activation gene 3, PD1: Programmed cell death protein 1, TIGIT: T-cell immunoreceptor with Ig and ITIM domains, TIM3: T-cell immunoglobulin and mucin domain 3.

Similar articles

References

    1. Andraus W, Tustumi F, de Meira Junior JD, Pinheiro RS, Waisberg DR, Lopes LD, et al. Molecular profile of intrahepatic cholangiocarcinoma. Int J Mol Sci. 2023;25:461. doi: 10.3390/ijms25010461. - DOI - PMC - PubMed
    1. Wu Q, Ellis H, Siravegna G, Michel AG, Norden BL, Fece de la Cruz F, et al. Landscape of clinical resistance mechanisms to FGFR inhibitors in FGFR2-Altered cholangiocarcinoma. Clin Cancer Res. 2024;30:198–208. doi: 10.1158/1078-0432.CCR-23-1317. - DOI - PMC - PubMed
    1. Ma L, Hernandez MO, Zhao Y, Mehta M, Tran B, Kelly M, et al. Tumor cell biodiversity drives microenvironmental reprogramming in liver cancer. Cancer Cell. 2019;36:418-30, e416. doi: 10.1016/j.ccell.2019.08.007. - DOI - PMC - PubMed
    1. Dong L, Lu D, Chen R, Lin Y, Zhu H, Zhang Z, et al. Proteogenomic characterization identifies clinically relevant subgroups of intrahepatic cholangiocarcinoma. Cancer Cell. 2022;40:70–87.e15. doi: 10.1016/j.ccell.2021.12.006. - DOI - PubMed
    1. Ghosh S, Oldenburg J, Czogalla-Nitsche KJ. The role of GRP and MGP in the development of non-hemorrhagic VKCFD1 phenotypes. Int J Mol Sci. 2022;23:798. doi: 10.3390/ijms23020798. - DOI - PMC - PubMed

LinkOut - more resources