

Development and application of a highly sensitive quadruple droplet digital PCR method for simultaneous quantification of sulfonamide resistance genes
- PMID: 40469733
- PMCID: PMC12133762
- DOI: 10.3389/fmicb.2025.1612740
Development and application of a highly sensitive quadruple droplet digital PCR method for simultaneous quantification of sulfonamide resistance genes
Abstract
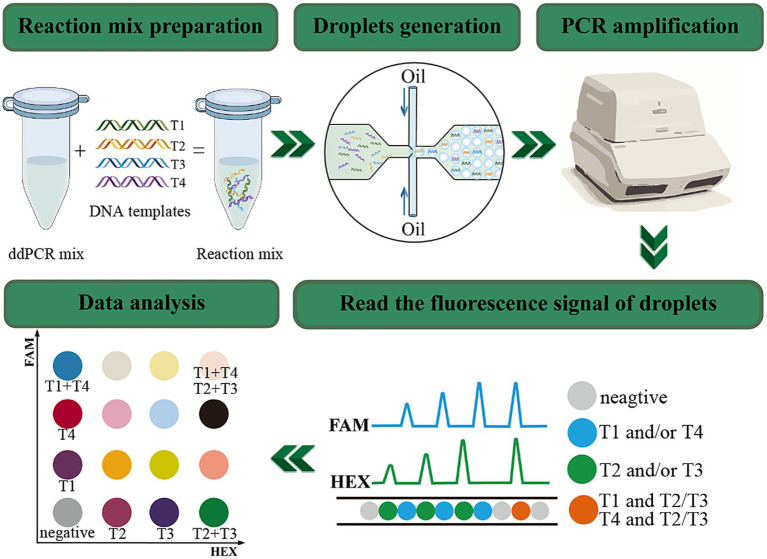
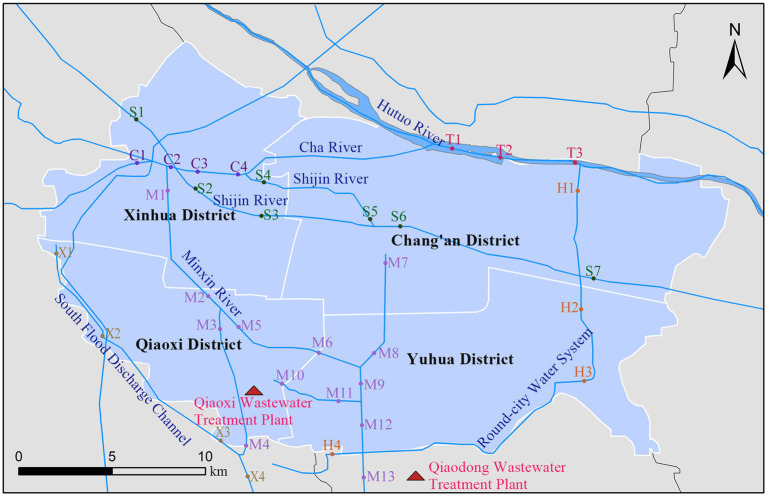
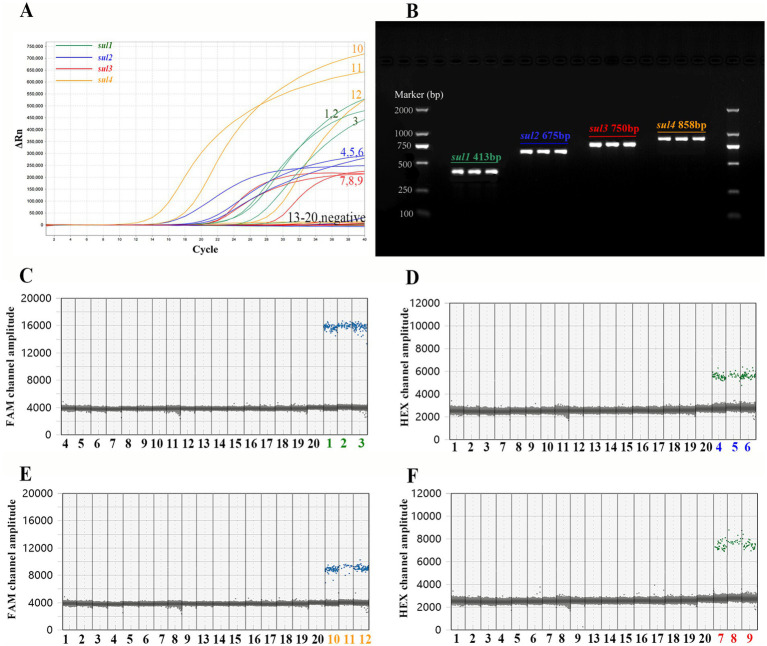
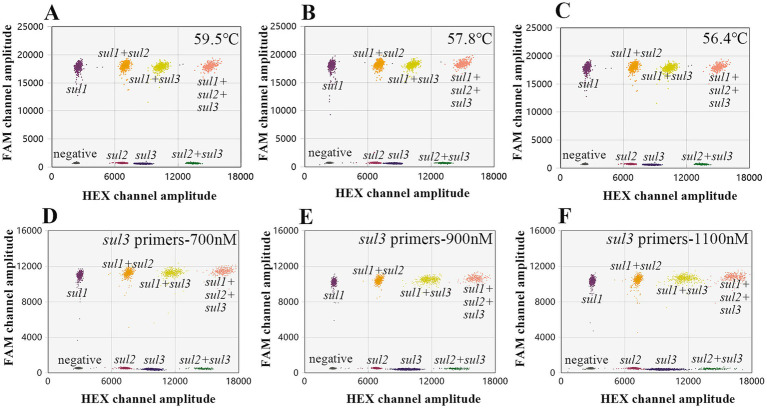
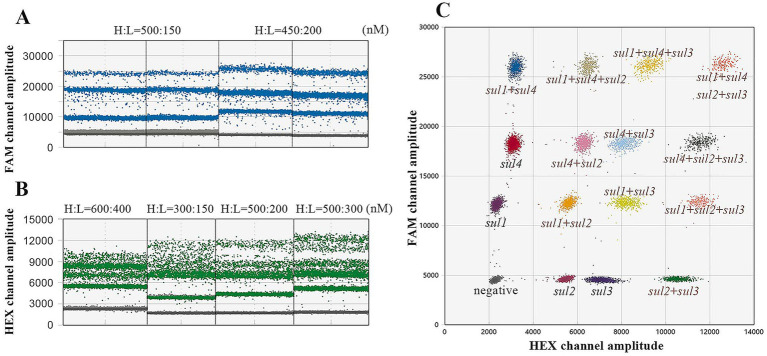
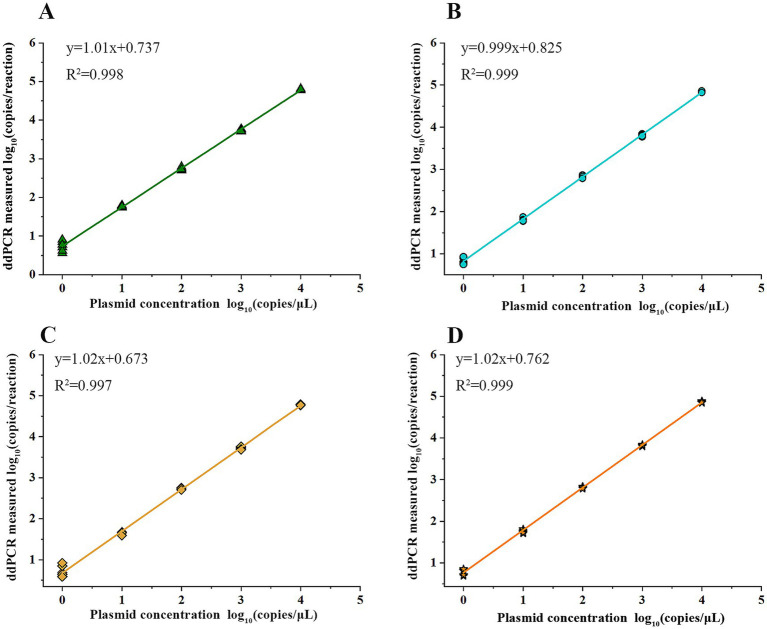
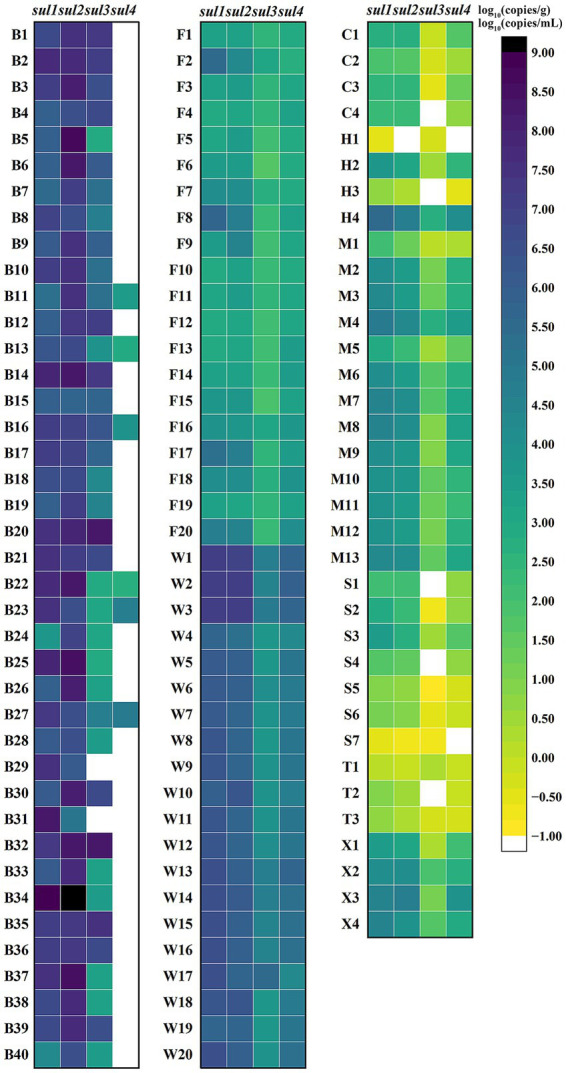
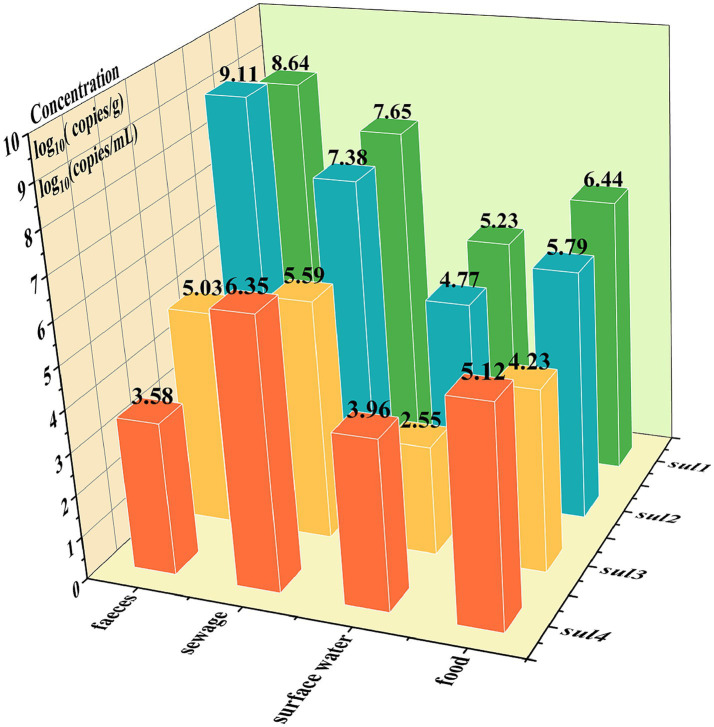
Sulfonamide resistance genes (sul genes) have a high detection rate and strong transmissibility. Therefore, there is an urgent need to develop more efficient detection methods to enhance the monitoring of sul genes. Current analytical methods are insufficient for the simultaneous and accurate quantification of all sulfonamides resistance genes. To overcome this limitation, a quadruple method was established by integrating droplet digital PCR (ddPCR) with the ratio-based probe-mixing strategy, achieving sensitive detection of sul1, sul2, sul3, and sul4 genes in diverse matrices. Correspondingly, the primers and probes of sul genes were meticulously designed and rigorously validated, and the critical parameters for ddPCR such as annealing temperature, concentrations of primers and probes were systematically optimized. As a results, the quadruple ddPCR method demonstrates excellent sensitivity with limits of detection (LOD) ranging from 3.98 to 6.16 copies/reaction, and good repeatability (coefficient of variation <25%), adequately meeting the requirement for accurate sul genes quantification. Furthermore, this new method was applied across 115 diverse samples, including human feces, animal-derived foods, sewage and surface water, achieving positive rates of 100% for sul1, 99.13% for sul2, 93.91% for sul3, and 68.70% for sul4, with sul genes concentration ranging from non-detection to 2.14 × 10⁹ copies/g. In summary, the developed quadruple ddPCR method has potential to serve as an efficient and sensitive tool for monitoring sul genes.
Keywords: animal-derived foods; droplet digital PCR; feces; quadruple detection; sewage; sulfonamide resistance genes; surface waters.
Copyright © 2025 Yin, Nie, Tian, Duan, Wu, Xu, Guo and Wang.
Conflict of interest statement
The authors declare that the research was conducted in the absence of any commercial or financial relationships that could be construed as a potential conflict of interest.
Figures
References
-
- Adelowo O. O., Helbig T., Knecht C., Reincke F., Mäusezahl I., Müller J. A. (2018). High abundances of class 1 integrase and sulfonamide resistance genes, and characterisation of class 1 integron gene cassettes in four urban wetlands in Nigeria. PLoS One 13:e0208269. doi: 10.1371/journal.pone.0208269, PMID: - DOI - PMC - PubMed
-
- Branchet P., Ariza Castro N., Fenet H., Gomez E., Courant F., Sebag D., et al. (2019). Anthropic impacts on sub-Saharan urban water resources through their pharmaceutical contamination (Yaoundé, Center Region, Cameroon). Sci. Total Environ. 660, 886–898. doi: 10.1016/j.scitotenv.2018.12.256, PMID: - DOI - PubMed
-
- Cavé L., Brothier E., Abrouk D., Bouda P. S., Hien E., Nazaret S. (2016). Efficiency and sensitivity of the digital droplet PCR for the quantification of antibiotic resistance genes in soils and organic residues. Appl. Microbiol. Biotechnol. 100, 10597–10608. doi: 10.1007/s00253-016-7950-5, PMID: - DOI - PubMed
-
- Ciesielski M., Blackwood D., Clerkin T., Gonzalez R., Thompson H., Larson A., et al. (2021). Assessing sensitivity and reproducibility of RT-ddPCR and RT-qPCR for the quantification of SARS-CoV-2 in wastewater. J. Virol. Methods 297:114230. doi: 10.1016/j.jviromet.2021.114230, PMID: - DOI - PMC - PubMed
LinkOut - more resources
Full Text Sources
Research Materials