

Gut mycobiome maturation and its determinants during early childhood: a comparison of ITS2 amplicon and shotgun metagenomic sequencing approaches
- PMID: 40469735
- PMCID: PMC12133761
- DOI: 10.3389/fmicb.2025.1539750
Gut mycobiome maturation and its determinants during early childhood: a comparison of ITS2 amplicon and shotgun metagenomic sequencing approaches
Abstract
Introduction: Microbial colonization of the gut in early life is important for the development of metabolism, immunity, and the brain. Fungi and bacteria both colonize the human infant gut. The relatively smaller contribution of fungi to the gut microbiome, as compared to bacteria, has posed technical challenges for the precise characterization of fungal communities (mycobiomes) and limited the ability to longitudinally examine mycobiome development.
Background: The aims of this study were to (1) characterize mycobiome maturation and identify clinical determinants of mycobiome compositional variation during the first 2 years of life and (2) compare two sequencing approaches (ITS2 amplicon and whole genome metagenomics) for characterizing mycobiome maturational features. Longitudinal fecal samples and associated clinical metadata were obtained from subjects enrolled as part of the MAGIC (Microbiome, Antibiotics and Growth Infant Cohort) study.
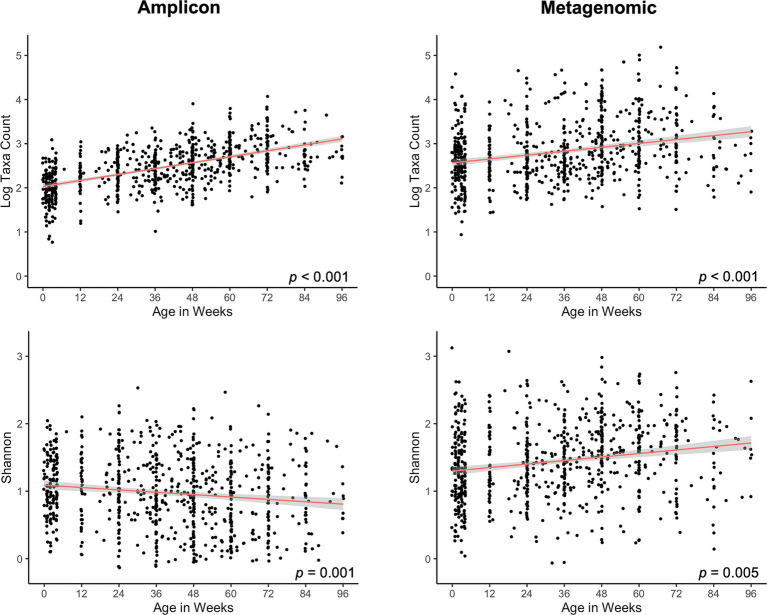
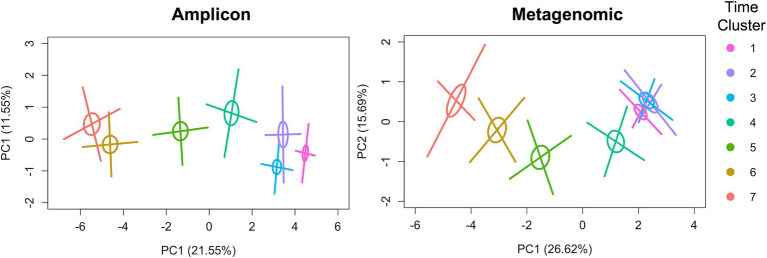
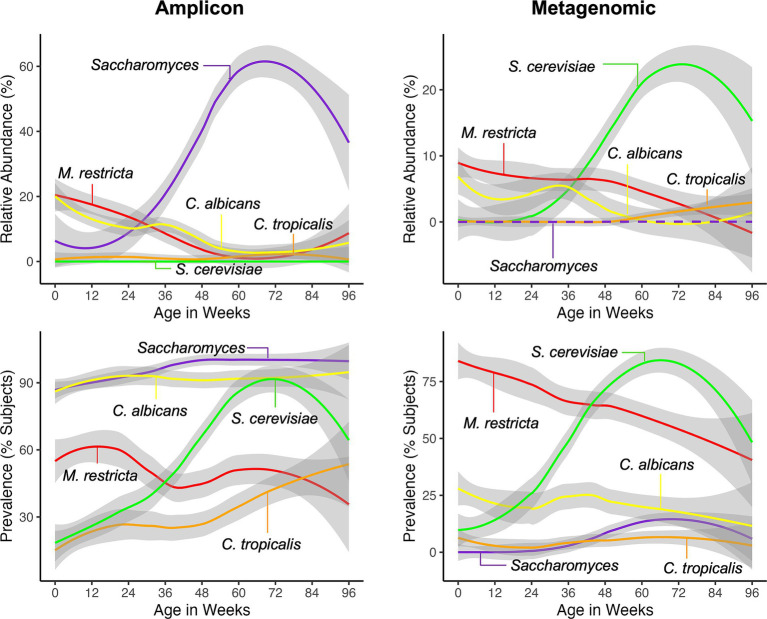
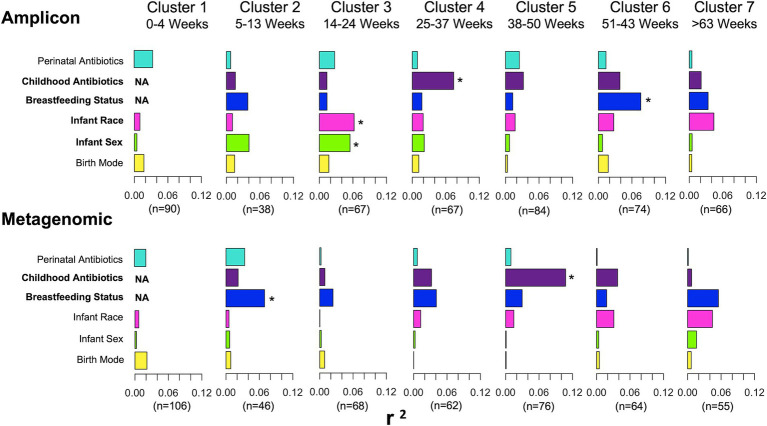
Results: Overall, fungal richness increased and mycobiome composition changed in a similar ordered pattern during the first 2 years of life utilizing either amplicon or metagenomic sequencing approaches. Less resolution of taxa to species and genera levels was observed for the metagenomic dataset. The predominant taxa identified by both sequencing approaches, Candida albicans, Saccharomyces/S. cerevisiae, and Malassezia restricta, each exhibited similar dynamics in abundances and prevalences over the first 2 years of life, irrespective of sequencing approach. Antibiotic exposure and breastfeeding status contributed to time-specific mycobiome compositional variation, results that were consistent for both types of sequence datasets. Candida albicans exhibited altered abundance dynamics in association with perinatal antibiotic exposure and birth mode for both sequencing approaches. Post hoc analyses suggested that the birth mode association could be driven by exposure to perinatal antibiotics in children delivered by cesarean section rather than by birth mode itself.
Discussion: In summary, amplicon and metagenomic sequencing approaches provide generally similar results with respect to mycobiome maturational dynamics and the contribution of clinical variables to variation. Differences in taxa identification by the two approaches likely due to sequence database differences, primer/genome sequence variation, and/or sequencing depth should be taken into consideration.
Keywords: ITS2 amplicon; childhood; gut mycobiome; longitudinal variation; whole genome shotgun metagenomics.
Copyright © 2025 Heisel, Gonia, Dillon, Hoops, Al-Ghalith, Gohl, Mukhopadhyay, Puopolo, Kennedy, Sadowsky, Knights, Johnson, Gerber and Gale.
Conflict of interest statement
The authors declare that the research was conducted in the absence of any commercial or financial relationships that could be construed as a potential conflict of interest.
Figures
References
-
- Al-Ghalith G., Knights D. (2017). Knights-lab/BURST: BURST v0.99.4a Technical report. Available online at: https://zenodo.org/record/836859#.YQoxOku_paQ (Accessed May, 2019).
-
- Amenyogbe N., Adu-Gyasi D., Enuameh Y., Asante K. P., Konadu D. G., Kaali S., et al. (2021). Bacterial and fungal gut community dynamics over the first 5 years of life in predominantly rural communities in Ghana. Front. Microbiol. 12:664407. doi: 10.3389/fmicb.2021.664407, PMID: - DOI - PMC - PubMed
LinkOut - more resources
Full Text Sources