

A Comparative Validation Study of Near Visual Acuity Assessment Using Different Handheld Acuity Charts
- PMID: 40469897
- PMCID: PMC12135357
- DOI: 10.1016/j.xops.2025.100790
A Comparative Validation Study of Near Visual Acuity Assessment Using Different Handheld Acuity Charts
Abstract
Objective: To develop a conversion table and compare the cross-validity of 3 types of widely utilized near vision charts: the ETDRS near chart, the N-notation chart, and the Rosenbaum chart.
Design: A prospective, cross-sectional, comparative validation study.
Participants: Aged ≥40 years.
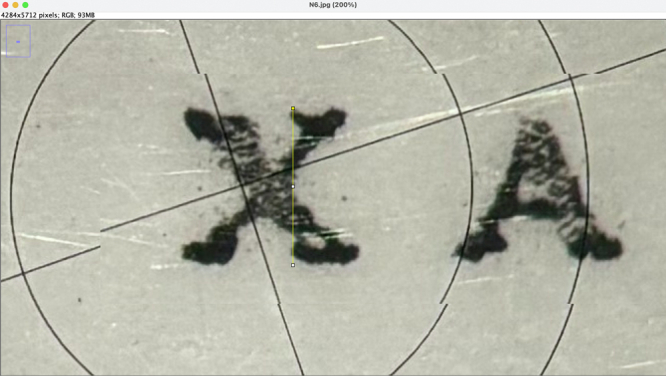
Methods: A conversion table for the 3 types of near charts was created using objective character sizing based on vertical height captured using a surgical microscope with a 10× magnification. Eligible presbyopic patients had their near vision tested sequentially with 3 near charts in a randomized order.
Main outcome measures: Pearson correlation coefficient (r) for the relationship among the near visual acuity charts. The consistency between the different charts was evaluated by Bland-Altman diagrams.
Results: A total of 204 participants (129 women, 63.2%) were recruited for the study (mean age, 58.9 ± 7.1 years). For correlation, r ranged from 0.596 to 0.836 (all P < 0.001). The Rosenbaum chart had the smallest range of difference against the ETDRS chart (standard deviation [SD] = 0.12), followed by the N-notation chart (SD = 0.15). Most of the converted logarithm of the minimum angle of resolution (logMAR) values from the N-notation and Rosenbaum charts were between 0.0 and 0.1 higher than the ETDRS logMAR equivalent (range: 0.07-0.11), with a tendency for both the N-notation and Rosenbaum charts to overestimate logMAR at more positive values.
Conclusions: We have developed a conversion table for 3 types of commonly used near vision charts. When compared with the ETDRS near chart, the Rosenbaum chart had a smaller range of difference than the N-notation chart. Both the Rosenbaum and N-notation charts tended to underestimate near vision at worse vision.
Financial disclosures: The author(s) have no proprietary or commercial interest in any materials discussed in this article.
Keywords: ETDRS near chart; N-notation chart; Near visual acuity; Presbyopia; Rosenbaum chart.
© 2025 by the American Academy of Ophthalmologyé.
Figures


Similar articles
-
Comparison of Visual Acuity Measurement Using Three Methods: Standard ETDRS Chart, Near Chart and a Smartphone-Based Eye Chart Application.Clin Ophthalmol. 2021 Feb 26;15:859-869. doi: 10.2147/OPTH.S304272. eCollection 2021. Clin Ophthalmol. 2021. PMID: 33664563 Free PMC article.
-
Comparison of applicability of different visual acuity charts for pediatric outpatient visual tests.Eye Sci. 2014 Jun;29(2):90-4. Eye Sci. 2014. PMID: 26011958
-
A comparison of visual acuity measured by ETDRS chart and Standard Logarithmic Visual Acuity chart among outpatients.Int J Ophthalmol. 2021 Apr 18;14(4):536-540. doi: 10.18240/ijo.2021.04.09. eCollection 2021. Int J Ophthalmol. 2021. PMID: 33875944 Free PMC article.
-
Is your vision blurry? A systematic review of home-based visual acuity for telemedicine.J Telemed Telecare. 2023 Feb;29(2):81-90. doi: 10.1177/1357633X20970398. Epub 2020 Nov 22. J Telemed Telecare. 2023. PMID: 33222600
-
Warning on inaccurate Rosenbaum cards for testing near vision.Surv Ophthalmol. 1997 Sep-Oct;42(2):169-74. doi: 10.1016/s0039-6257(97)00055-6. Surv Ophthalmol. 1997. PMID: 9381371 Review.
Cited by
-
Near Visual Acuity Measurements by Community Screeners Using Digital (Peek) Testing Versus Conventional Charts in India.Transl Vis Sci Technol. 2025 Aug 1;14(8):24. doi: 10.1167/tvst.14.8.24. Transl Vis Sci Technol. 2025. PMID: 40828523 Free PMC article.
References
-
- GBD 2019 Blindness and Vision Impairment Collaborators Vision loss expert Group of the global burden of disease study. Causes of blindness and vision impairment in 2020 and trends over 30 years, and prevalence of avoidable blindness in relation to VISION 2020: the right to sight: an analysis for the global burden of disease study. Lancet Glob Health. 2021;9:e144–e160.
-
- Bourne R.R.A., Flaxman S.R., Braithwaite T., et al. Magnitude, temporal trends, and projections of the global prevalence of blindness and distance and near vision impairment: a systematic review and meta-analysis. Lancet Glob Health. 2017;5:e888–e897. - PubMed
-
- GBD 2019 Blindness and Vision Impairment Collaborators Vision loss expert Group of the global burden of disease study. Trends in prevalence of blindness and distance and near vision impairment over 30 years: an analysis for the global burden of disease study. Lancet Glob Health. 2021;9:e130–e143.
-
- Vasavada V., Vasavada S.A., Shastri L., et al. Visual outcomes comparing emmetropia vs mini-monovision after bilateral implantation of a nondiffractive extended vision intraocular lens: randomized trial. J Cataract Refract Surg. 2024;50:799–804. - PubMed
LinkOut - more resources
Full Text Sources
