. 2025 May 21:12:1538708.
doi: 10.3389/fmed.2025.1538708. eCollection 2025.

Identifying central symptom clusters and correlates among post-COVID-19 pulmonary fibrosis patients: a network analysis

Affiliations

Identifying central symptom clusters and correlates among post-COVID-19 pulmonary fibrosis patients: a network analysis

Zhen Yang et al. Front Med (Lausanne). .

Abstract

Background: Previous studies have analyzed symptom clusters in patients with coronavirus disease 2019 (COVID-19); however, evidence regarding the core symptom clusters and their influencing factors in patients with post-COVID-19 pulmonary fibrosis (PCPF) remains unclear, affecting the precision of symptom interventions.

Objectives: This study aimed to identify the symptom clusters and core symptom clusters in patients with PCPF. Demographic and disease-related factors associated with these symptom clusters were also analyzed.

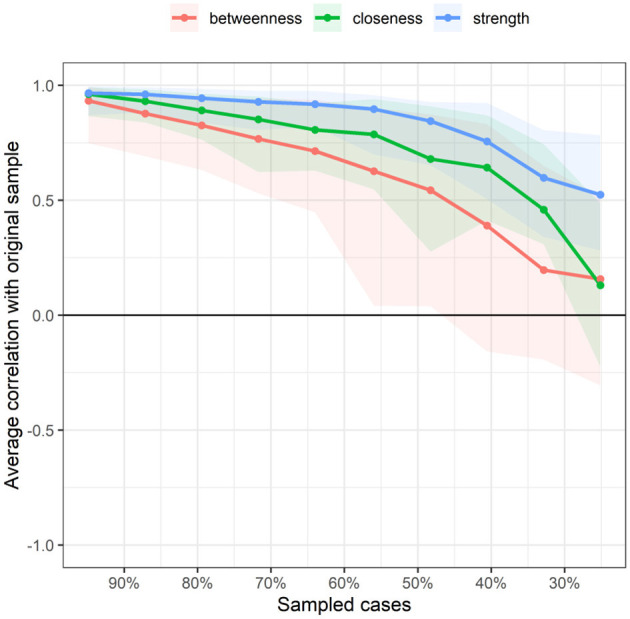
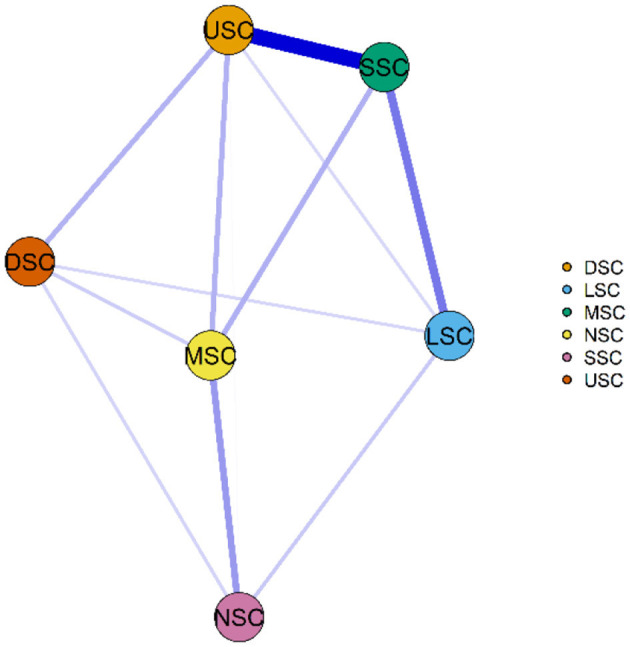
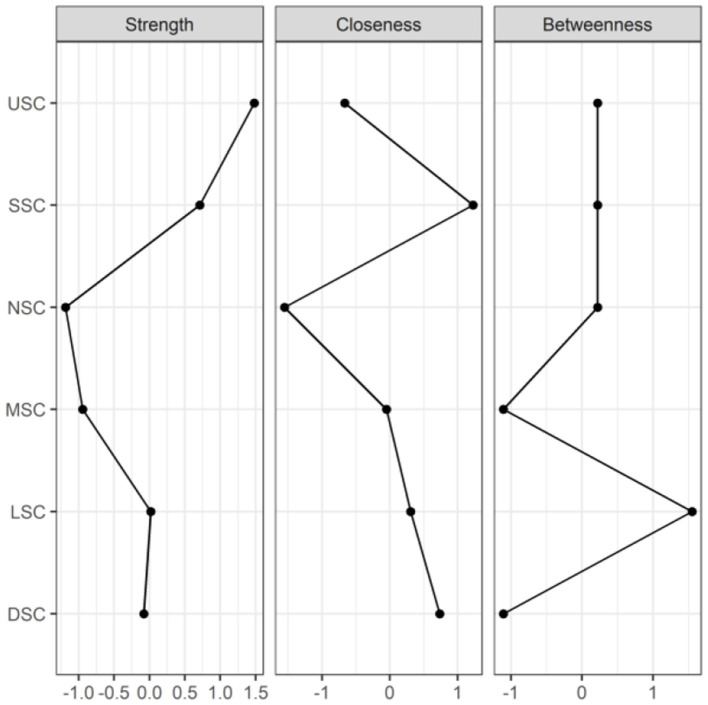
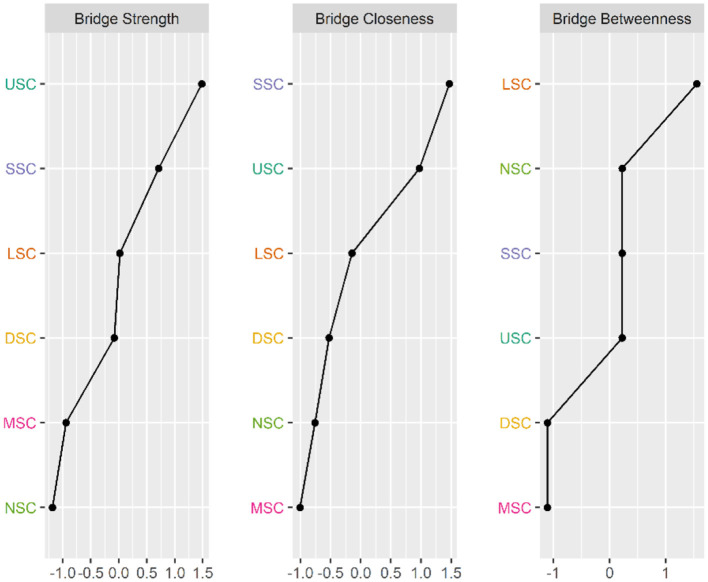
Methods: A total of 350 patients with PCPF were recruited from China between January 2023 and April 2024. A self-reported symptom assessment scale was used for this survey. Principal component analysis was used to identify symptom clusters. Network analysis was used to describe the relationships between the symptoms and symptom clusters. Multiple linear models were used to analyze the factors affecting the total symptom severity and each symptom cluster.

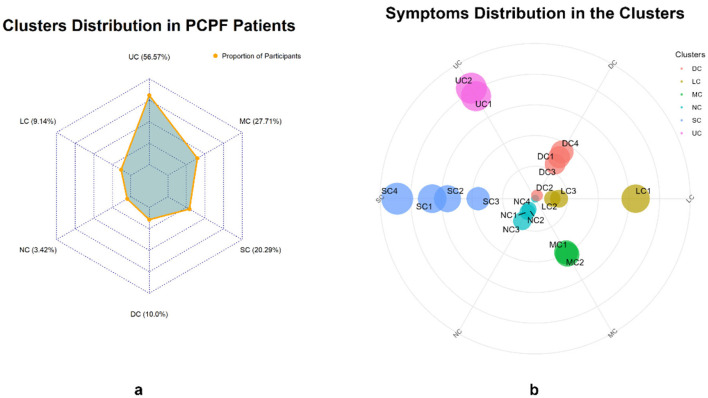
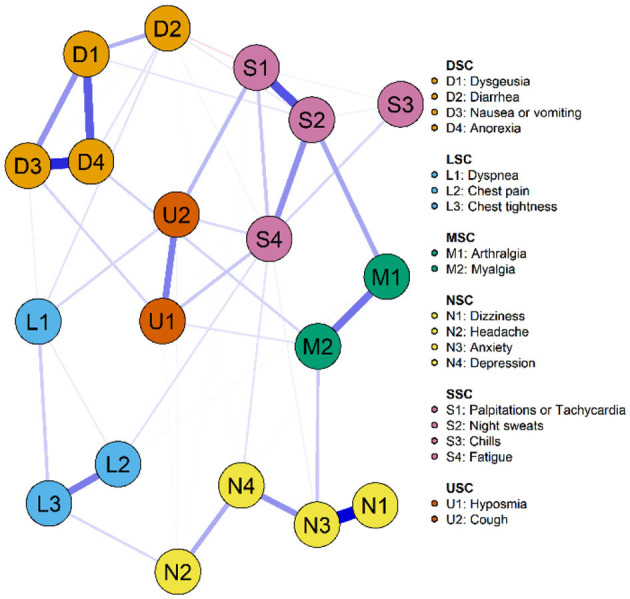
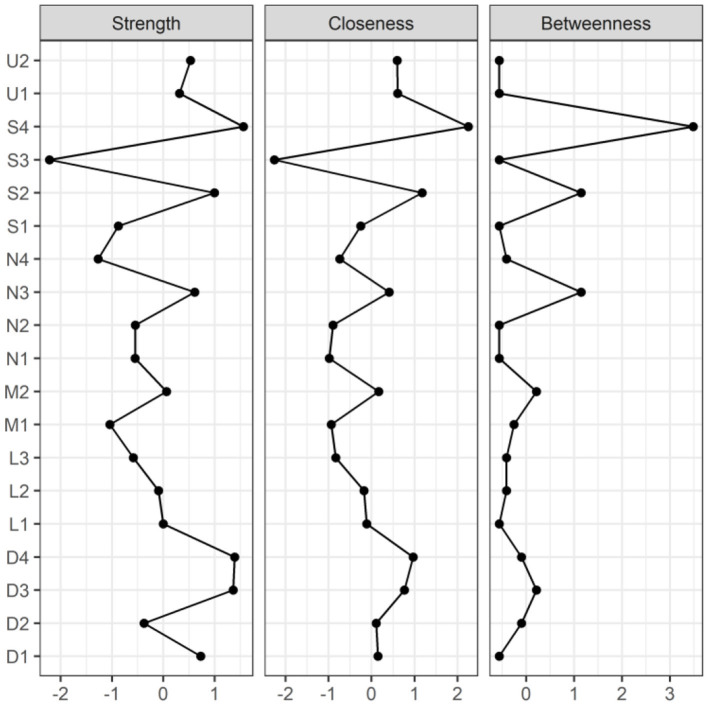
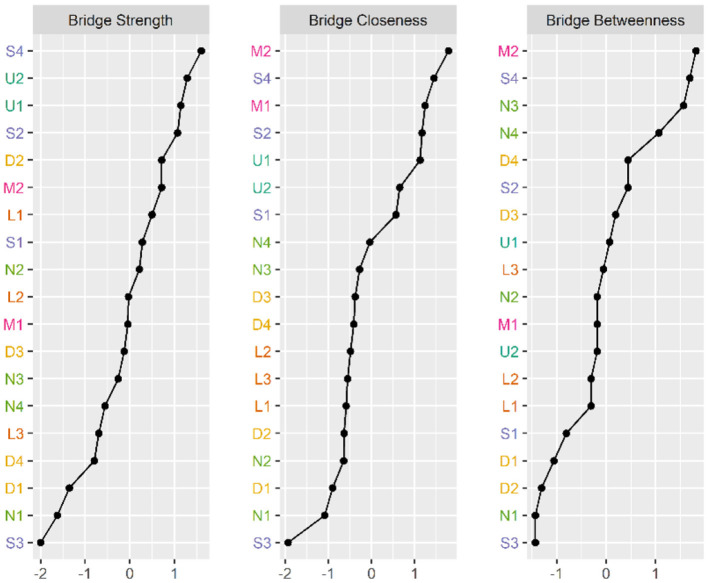
Results: Six symptom clusters were identified: Upper Respiratory Tract Symptom Cluster (USC), Lower Respiratory Tract Symptom Cluster (LSC), Somatic Symptom Cluster (SSC), Muscular and Joint Symptom Cluster (MSC), Neurological and Psychological Symptom Cluster (NSC), and Digestive Symptom Cluster (DSC). Fatigue was identified as the core and bridge symptom in the symptom network, whereas the upper respiratory symptom cluster was identified as the core and bridge symptom cluster. Gender, age, educational level, smoking history, and primary caregiver were associated with the scores of the six symptom clusters.

Conclusion: Our study suggests that there is a need to evaluate symptom clusters for the improvement of symptom management among PCPF. Specifically, the assessment and treatment of upper respiratory and fatigue symptoms as core targets of PCPF care is critical for the development of accurate and efficient symptom management strategies.

Keywords: COVID-19; interstitial; lung diseases; pulmonary fibrosis; social network analysis; syndrome.


Conflict of interest statement

The authors declare that the research was conducted in the absence of any commercial or financial relationships that could be construed as a potential conflict of interest.

Figures

Figure 1
Figure 1
Distribution of symptom groups (a) and weight of internal symptoms (b).
Figure 2
Figure 2
Symptom network of PCPF patients. “Nodes” represent symptoms, and “edges” represent the relationships between symptoms. Red edges indicate negative correlations, while blue edges indicate positive correlations. Thicker edges, closer distances, and darker colors signify stronger correlations between nodes, whereas thinner edges, farther distances, and lighter colors signify weaker correlations between nodes.
Figure 3
Figure 3
Centrality indicators of symptoms' network nodes. D1, Dysgeusia; D2, Diarrhea; D3, Nausea or vomiting; D4, Anorexia; L1, Dyspnea; L2, Chest pain; L3, Chest tightness; M1, Arthralgia; M2, Myalgia; N1, Dizziness; N2, Headache; N3, Anxiety; N4, Depression; S1, Palpitations or Tachycardia; S2, Night sweats; S3, Chills; S4, Fatigue; U1, Hyposmia; U2, Cough.
Figure 4
Figure 4
Bridge Centrality indicators of symptoms' network nodes. D1, Dysgeusia; D2, Diarrhea; D3, Nausea or vomiting; D4, Anorexia; L1, Dyspnea; L2, Chest pain; L3, Chest tightness; M1, Arthralgia; M2, Myalgia; N1, Dizziness; N2, Headache; N3, Anxiety; N4, Depression; S1, Palpitations or Tachycardia; S2, Night sweats; S3, Chills; S4, Fatigue; U1, Hyposmia; U2, Cough.
Figure 5
Figure 5
Related stability analysis of symptom network. The red area represents the accuracy of Betweenness, the green area represents the accuracy of Closeness, and the blue area represents the accuracy of Strength. The smaller the area, the smaller the 95% confidence interval, and the higher the accuracy of the centrality index.
Figure 6
Figure 6
Symptom cluster network of PCPF patients. “Nodes” represent symptom Clusters, and “edges” represent the relationships between symptoms. Red edges indicate negative correlations, while blue edges indicate positive correlations. Thicker edges, closer distances, and darker colors signify stronger correlations between nodes, whereas thinner edges, farther distances, and lighter colors signify weaker correlations between nodes. USC, Upper Respiratory Tract Symptom Cluster; MSC, Muscular and Joint Symptom Cluster; SSC, Somatic Symptom Cluster; DSC, Digestive Symptom Cluster; LSC, Lower Respiratory Tract Symptom Cluster; NSC, Neurological and Psychological Symptom Cluster.
Figure 7
Figure 7
Centrality indicators of symptoms' network nodes. USC, Upper Respiratory Tract Symptom Cluster; MSC, Muscular and Joint Symptom Cluster; SSC, Somatic Symptom Cluster; DSC, Digestive Symptom Cluster; LSC, Lower Respiratory Tract Symptom Cluster; NSC, Neurological and Psychological Symptom Cluster.
Figure 8
Figure 8
Bridge Centrality indicators of symptoms cluster' network nodes. USC, Upper Respiratory Tract Symptom Cluster; MSC, Muscular and Joint Symptom Cluster; SSC: Somatic Symptom Cluster; DSC, Digestive Symptom Cluster; LSC, Lower Respiratory Tract Symptom Cluster; NSC, Neurological and Psychological Symptom Cluster.
Figure 9
Figure 9
Related stability analysis of symptom cluster network. The red area represents the accuracy of Betweenness, the green area represents the accuracy of Closeness, and the blue area represents the accuracy of Strength. The smaller the area, the smaller the 95% confidence interval, and the higher the accuracy of the centrality index.

Similar articles

References

    1. dashboard WC-. Number of COVID-19 cases reported to WHO. (2024). Available online at: https://data.who.int/dashboards/covid19/cases?n=c (accessed November 4, 2024).
    1. Prevention . CfDCa. COVID-19 mortality update—United States, 2022. (2023). Available online at: https://www.cdc.gov/%20mmwr/volumes/72/wr/mm7218a4.htm (accessed November 4, 2024).
    1. Fernández-de-Las-Peñas C, Notarte KI, Peligro PJ, Velasco JV, Ocampo MJ, Henry BM, et al. . Long-COVID symptoms in individuals infected with different SARS-CoV-2 variants of concern: a systematic review of the literature. Viruses. (2022) 14:2629. 10.3390/v14122629 - DOI - PMC - PubMed
    1. Gao P, Liu J, Liu M. Effect of COVID-19 vaccines on reducing the risk of long COVID in the real world: a systematic review and meta-analysis. Int J Environ Res Public Health. (2022) 19:12422. 10.3390/ijerph191912422 - DOI - PMC - PubMed
    1. Lane A, Hunter K, Lee EL, Hyman D, Bross P, Alabd A, et al. . Clinical characteristics and symptom duration among outpatients with COVID-19. Am J Infect Control. (2022) 50:383–9. 10.1016/j.ajic.2021.10.039 - DOI - PMC - PubMed

LinkOut - more resources