

doi: 10.12688/wellcomeopenres.24257.1.
eCollection 2025.
The genome sequence of the great crested newt, Triturus cristatus (Laurenti, 1768)
Affiliations
- PMID: 40470061
- PMCID: PMC12134737
- DOI: 10.12688/wellcomeopenres.24257.1
Item in Clipboard
The genome sequence of the great crested newt, Triturus cristatus (Laurenti, 1768)
Wellcome Open Res.
.
Abstract
We present a genome assembly from a female specimen of Triturus cristatus (great crested newt; Chordata; Amphibia; Caudata; Salamandridae). The genome sequence has a total length of 22,324.62 megabases. Most of the assembly (98.78%) is scaffolded into 12 chromosomal pseudomolecules. The mitochondrial genome has also been assembled, with a length of 16.54 kilobases.
Keywords: (Great or Northern) Crested Newt; Caudata; Triturus cristatus; chromosomal; genome sequence.
Copyright: © 2025 Streicher JW et al.
Conflict of interest statement
No competing interests were disclosed.
Figures

Female voucher specimen of
Triturus cristatus (NHMUK 2022.7580, Field ID, JWS 916; Snout-vent length 82.6 mm) from which the genome was sequenced in lateral (
A), dorsal (
B), and ventral (
C) views. The individual was collected from Gilbert White’s House and Gardens in Selbourne, England. Two views of the garden pond where the specimen was collected via dip netting (
D–
E).

The BlobToolKit snail plot provides an overview of assembly metrics and BUSCO gene completeness. The circumference represents the length of the whole genome sequence, and the main plot is divided into 1,000 bins around the circumference. The outermost blue tracks display the distribution of GC, AT, and N percentages across the bins. Scaffolds are arranged clockwise from longest to shortest and are depicted in dark grey. The longest scaffold is indicated by the red arc, and the deeper orange and pale orange arcs represent the N50 and N90 lengths. A light grey spiral at the centre shows the cumulative scaffold count on a logarithmic scale. A summary of complete, fragmented, duplicated, and missing BUSCO genes in the tetrapoda_odb10 set is presented at the top right. An interactive version of this figure is available at
https://blobtoolkit.genomehubs.org/view/GCA_964204655.1/dataset/GCA_964204655.1/snail .
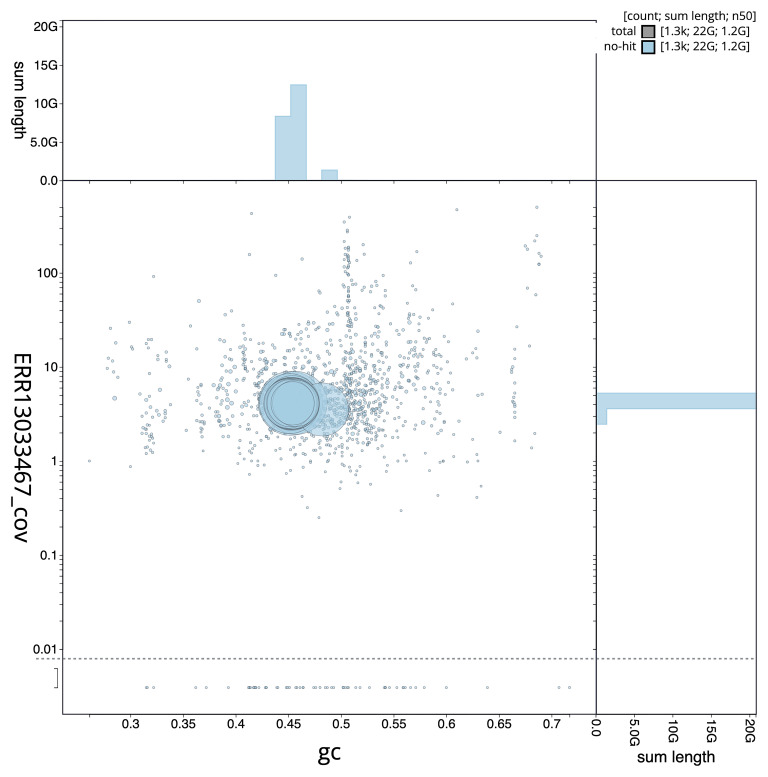
Blob plot showing sequence coverage (vertical axis) and GC content (horizontal axis). The circles represent scaffolds, with the size proportional to scaffold length and the colour representing phylum membership. The histograms along the axes display the total length of sequences distributed across different levels of coverage and GC content. An interactive version of this figure is available at
https://blobtoolkit.genomehubs.org/view/GCA_964204655.1/dataset/GCA_964204655.1/blob .

The grey line shows cumulative length for all scaffolds. Coloured lines show cumulative lengths of scaffolds assigned to each phylum using the buscogenes taxrule. An interactive version of this figure is available at
https://blobtoolkit.genomehubs.org/view/GCA_964204655.1/dataset/GCA_964204655.1/cumulative .

Chromosomes are shown in order of size from left to right and top to bottom.
References
-
- AmphibiaWeb: Triturus cristatus: great crested newt.2021. Reference Source
-
- Arnold HR: Atlas of amphibians and reptiles in Britain. London: HMSO,1995. Reference Source
LinkOut - more resources
Full Text Sources
