[Preprint]. 2025 May 15:rs.3.rs-6448305.
doi: 10.21203/rs.3.rs-6448305/v1.

Semaphorin-7A promotes macrophage-mediated mammary epithelial and ductal carcinoma in situ invasion

Affiliations

Semaphorin-7A promotes macrophage-mediated mammary epithelial and ductal carcinoma in situ invasion

Petra A Dahms et al. Res Sq. .

Abstract

Background: Ductal carcinoma in situ (DCIS) accounts for 20-30% of all breast cancer diagnoses. Considered stage 0, DCIS is contained in the ducts by the myoepithelium that surround the luminal cells in the mammary gland. DCIS can progress to invasive ductal carcinoma (IDC) if the tumor cells break through the myoepithelium and invade the surrounding breast tissue. While 30-50% of DCIS tumors will progress to IDC, a majority will remain in a DCIS-like state. The mechanisms that drive this progression are not completely understood. There is currently no clinically recognized biomarker for predicting risk of DCIS progression. Therefore, all DCIS tumors are treated with standard of care, resulting in overtreatment. We have previously identified independent roles for semaphorin-7A (SEMA7A) and collagen in promoting DCIS progression to IDC.

Methods: To investigate the relationship between SEMA7A and collagen remodeling in the mammary gland, we utilized patient tissues and mouse models of normal development and DCIS progression as well as a novel SEMA7A-blocking antibody.

Results: We show that SEMA7A increases in patient samples of DCIS compared to matched normal tissues and in IDC compared to matched DCIS and normal tissues. This increase was correlated with the presence of CD68 + macrophages. Using puberty in the mammary gland as a model for normal epithelial invasion facilitated by macrophages, we show SEMA7A knockout mice exhibit delayed ductal elongation as well as decreased macrophages. Additionally, our SEMA7A-blocking antibody in a mouse model of DCIS decreased invasive tumor phenotypes and decreased organized collagen around the tumor. The invasive tumors had increased collagen and macrophage influx in the tumor. Finally, we show that SEMA7A activates an AKT/GSK3β/β-catenin signaling pathway within macrophages to promote expression of pro-inflammatory cytokines and the matrix remodeling enzyme MMP9 to facilitate invasion.

Conclusions: Our results demonstrate that SEMA7A regulates normal and transformed epithelial cell invasion through regulation of pro-invasive matrix remodeling via macrophages. Our studies also suggest that SEMA7A expression, macrophage phenotype, and collagen structure may be a predictor of risk for DCIS invasion. Thus, blocking SEMA7A may be a novel therapeutic strategy for high-risk DCIS patients to slow or prevent progression of disease.

Keywords: DCIS; ECM; SEMA7A; invasion; macrophage; matrix-remodeling.


Conflict of interest statement

Declarations Competing interests: TRL holds patent for SmAbH1. Other authors declare that they have no competing interests.

Figures

Figure 1
Figure 1
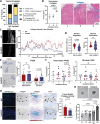
SEMA7A is positively correlated with CD68 in DCIS and IDC tissues. (A-B) (top) Representative images of NAT, DCIS, and IDC from DCIS and DCIS+IDC tissues showing SEMA7A expression (brown), CD68 expression (pink) and CD68+ cells (black arrows). (bottom) Corresponding images showing mask for SEMA7A expression (yellow), CD68 expression (cyan), and negative expression (black). (C-D) Percent positive pixels for SEMA7A and (E-F) CD68 by quantitative IHC in tumor microarrays for NAT, DCIS and IDC tissues, in patients with DCIS (TMA1) (C, D) or DCIS+IDC (TMA2)(E, F). (G-H) Correlation analysis of SEMA7A and CD68 expression evaluated in all tissues from the DCIS (TMA1) and DCIS+IDC (TMA2) patient tumor microarrays. P values determined by paired two-tailed t-test (C-F). p<000.1 by two-tailed Pearson correlation analysis (G-H).
Figure 2
Figure 2
Loss of SEMA7A delays ductal elongation during pubertal development in the mammary gland. Representative whole mount images of WT (top) and KO (bottom) mice at 8 weeks (left) and 12 weeks (right). (B) Quantification of ductal elongation as a percent of tissue invasion past the LN during pubertal development timepoints. (C) Quantification of branch end points past the LN via mammary gland whole mount analysis. (D) Quantification of TEBs past the LN via mammary gland whole mount analysis. (E) Representative close-up whole mount images of TEBs at 5 weeks of age. (F) Quantification of ducts per MFP as the number of ducts by MFP area. Two-way ANOVA, ptimepoint=0.0006; pstrain=0.2793, pinteraction=0.04963. (G) Quantification of acini per MFP as the number of acini by MFP area. Two-way ANOVA, ptimepoint=0.0006; pstrain=0.0225, pinteraction=0.0915. (H) Quantification of TEBs in the MFP as a percent of total epithelial structures (ducts+acini). TEBs defined as occluded acini with increased proliferation via increased Ki67 expression. Two-way ANOVA, ptimepoint=0.0042; pstrain=0.8658, pinteraction=0.0371. (I) Quantification of proliferative epithelial structures in the MFP via Ki67 expression as a percent of total epithelial structures (ducts+acini). Two-way ANOVA, ptimepoint=0.0034; pstrain=0.2843, pinteraction=0.0106. (I) Representative image of proliferative TEB, duct, and acini in 5 week WT mammary gland. (B-C) WT, n=4–9; KO, n=5–6. (E-H) WT: 5wk, n=6; 8wk, n=2; 12wk, n=5. KO: 5wk, n=3; 8wk, n=5; 12wk, n=4. p values determined by paired two-tailed t-test (B-C, E-H).
Figure 3
Figure 3
Knocking out SEMA7A decreases macrophages in the mammary gland during pubertal development. (A-C) Representative images from WT or Sema7a KO (Sema7atm1Alk/J) mouse during pubertal development, at 5 weeks, 8 weeks, and 12 weeks of age; Ki67 (A), trichrome stain (B), and F4/80 (C). Black arrows denote observed changes in staining. (D) Quantification of Ki67 IHC in acini as a percent area of acini. Two-way ANOVA, ptimepoint=0.0126, pstrain=0.8256, pinteraction=0.0095. (E) Quantification of stromal collagen as a percent area of the stroma. Two-way ANOVA, ptimepoint=0.7432, pstrain=0.0177, pinteraction=0.0356. (F) Quantification of stromal F4/80 IHC as a percent area of the stroma. Two-way ANOVA, ptimepoint=0.4382, pstrain=0.0021, pinteraction=0.0496. (G) Quantification of epithelium-associated F4/80 IHC as a percent area of epithelial structures. Two-way ANOVA, ptimepoint=0.1192, pstrain=0.3220, pinteraction=0.0498. (D-G) p values determined by two-tailed t-test.
Figure 4
Figure 4
Treatment of DCIS tumors in mice with SmAbH1 decreases invasion of DCIS via stromal changes. (A) Quantification of tumor invasion scores per treatment group. IgG, n=20; SmAbH1, n=19. Significance by chi-square test. (B) Collagen expression in DCIS tumors. (left) Representative images of trichrome stain in DCIS tumors. (right) Quantification of collagen expression (blue stain) as a percent area in the tumor by invasion score. (C) Collagen intensity analysis by SHG. (left) Representative images of SHG of the tumor border and surrounding stroma. (right) Collagen intensity over distance from tumor border by treatment group. IgG, SmAbH1, n=3. (D) Quantification of stromal collagen alignment and orientation from SHG images of the stromal region outside the tumor border. IgG, n=12; SmAbH1, n=10. For orientation (right), F-test comparison of variance, p=0.0514. (F) F4/80 positive macrophage analysis by treatment group. (left) Representative images of F4/80 positive macrophages in the stroma outside the tumors. (right) Quantification of F4/80 positive macrophages as a percent area of tumor and stroma by treatment group. (F) Quantification of F4/80 positive macrophages as a percent area of the stroma (left) and intra-tumor (right) by invasion score. (G) In situ zymography (DQ-gelatin assay). (left) Representative images of tumor border with positive protease activity signals from left to right: fluorescent images, gray scale of DQ-gelatin fluorescent signal, histogram of high to low fluorescent signal, F4/80 IHC. Black arrows indicate colocalization of fluorescent signal with F4/80. (right) Quantification of protease activity at the tumor border by treatment. (H) DCIS organoid invasion assay co-cultured with RAW264.7 macrophages and/or 40ug/mL SEMA7A or 10% collagen. (top) Representative images of non-invasive and invasive organoids with organoid edge outlined. (bottom) Quantification of percent invasive MCF10DCIS.com organoids. (B, D, F) P values determined by two-tailed t-test. (E-G) P values determined by one-tailed t-test.
Figure 5
Figure 5
SEMA7A promotes protease and cytokine expression in RAW264.7 macrophages through a β1-integrin/AKT/GSK3β/β-catenin signaling pathway. (A) SEMA7A signaling cascade in macrophages. (B) Western blot of cell lysates from RAW264.7 macrophages treated with PBS or 40μg/mL SEMA7A. Phosphorylated protein signal values were normalized to GAPDH and total protein then fold change to average PBS. (C) Active β-catenin signal in RAW264.7 macrophages after treatment with PBS or SEMA7A. (left) Representative IF images of active β-catenin nuclear localization. (right) Quantification of nuclear active β-catenin signal. (D) qPCR analysis of β-catenin target genes in RAW264.7 macrophages as relative mRNA expression fold-change to PBS: Ptgs2, Tnfa, Myc, Il1b, Il4, and Il6. (E) (left) MMP zymography of conditioned media from RAW264.7 macrophages treated with PBS or SEMA7A, including MMP9 (black arrow, 82kDa). (right) Quantification of MMP9 signal intensity as fold change to average PBS. P values determined by one-tailed (C-D) or two-tailed (E) t-test.

Similar articles

References

    1. Siegel RL, Giaquinto AN, Jemal A. Cancer statistics, 2024. CA: a cancer journal for clinicians. 2024;74(1):12–49. - PubMed
    1. Giaquinto AN, Sung H, Miller KD, Kramer JL, Newman LA, Minihan A, et al. Breast cancer statistics, 2022. CA: a cancer journal for clinicians. 2022;72(6):524–41. - PubMed
    1. Kerlikowske K. Epidemiology of ductal carcinoma in situ. Journal of the National Cancer Institute Monographs. 2010;2010(41):139–41. - PMC - PubMed
    1. van Seijen M, Lips EH, Thompson AM, Nik-Zainal S, Futreal A, Hwang ES, et al. Ductal carcinoma in situ: to treat or not to treat, that is the question. British journal of cancer. 2019;121(4):285–92. - PMC - PubMed
    1. Wang J, Li B, Luo M, Huang J, Zhang K, Zheng S, et al. Progression from ductal carcinoma in situ to invasive breast cancer: molecular features and clinical significance. Signal transduction and targeted therapy. 2024;9(1):83. - PMC - PubMed

Publication types

LinkOut - more resources