[Preprint]. 2025 May 13:rs.3.rs-6180510.
doi: 10.21203/rs.3.rs-6180510/v1.

Calcium channel-coupled transcription factors facilitate direct nuclear signaling

Affiliations

Calcium channel-coupled transcription factors facilitate direct nuclear signaling

Eshaan R Rao et al. Res Sq. .

Abstract

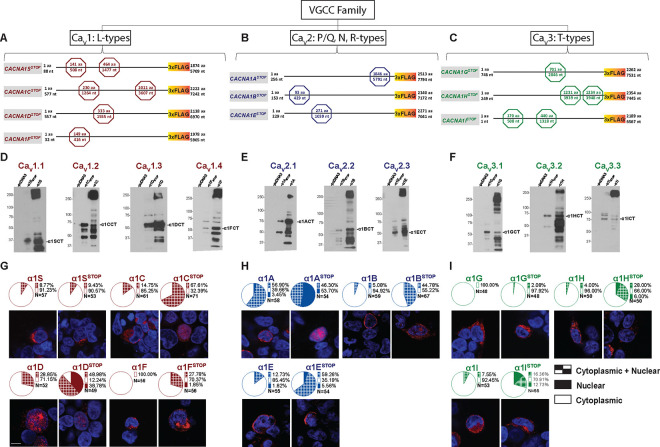
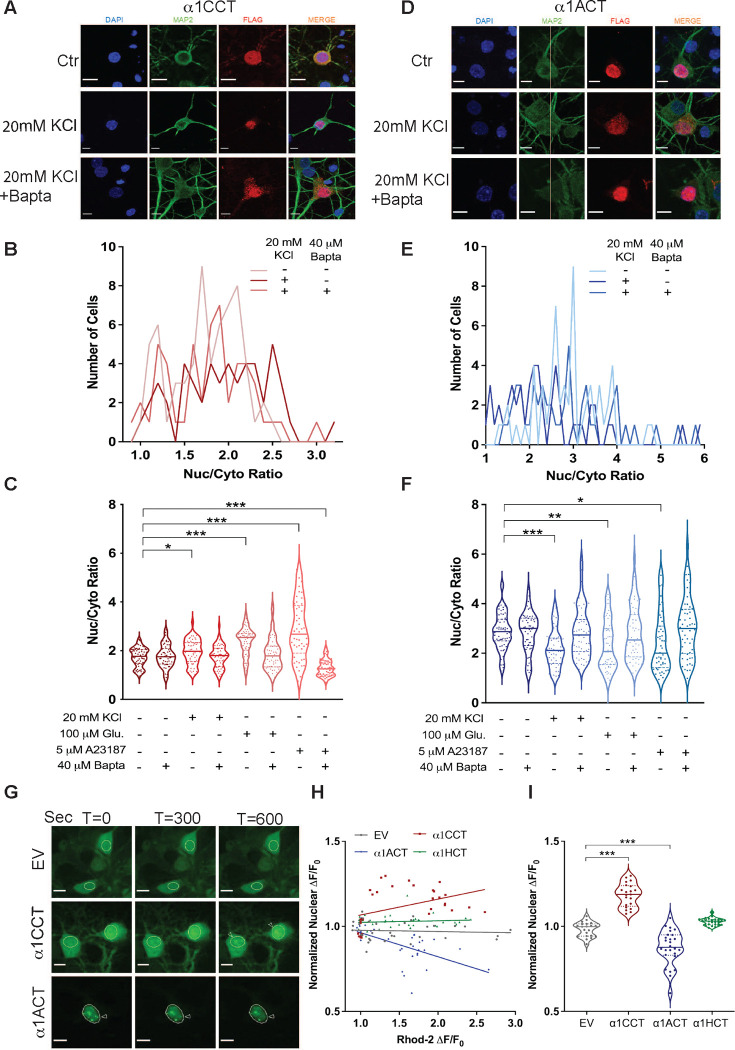
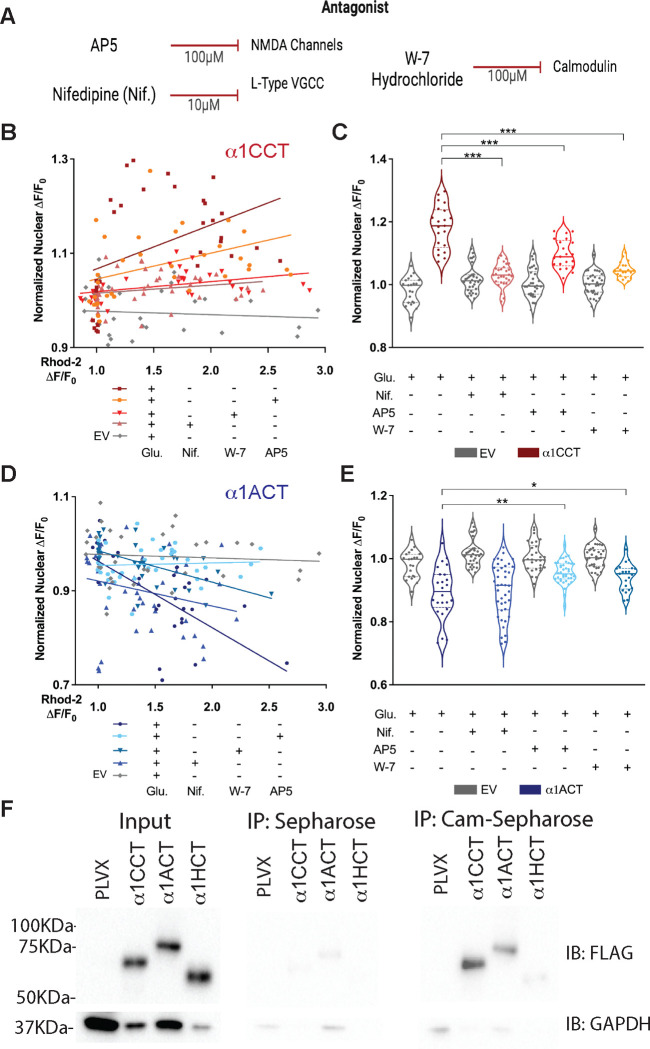
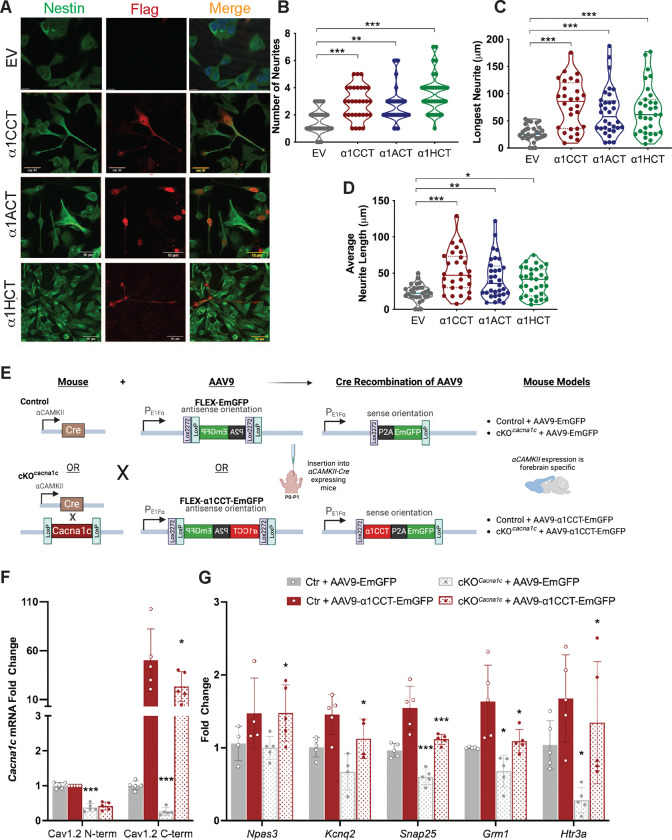
VGCCs play crucial roles within the CNS, in maintaining cell excitability, enabling activity-dependent neuronal development, and forming long-term memory by regulating Ca2+ influx. The intracellular carboxyl-terminal domains of VGCC α1 subunits help regulate VGCC function. Emerging evidence suggests that some VGCC C-termini have functions independent of channel gating and exist as stable proteins. Here, we demonstrate that all VGCC gene family members express bicistronic mRNA transcripts that produce functionally distinct C-terminal proteins (CTPs) in tandem with full-length VGCC α1 subunits. Two of these CTPs, α1CCT and α1ACT, cycle to and from the nucleus in a Ca2+- and calmodulin-dependent fashion. α1CCT, α1ACT, and α1HCT regulate chromatin accessibility and/or bind directly to genes, regulating gene networks involved in neuronal differentiation and synaptic function in a Ca2+-dependent manner. This study elucidates a conserved process of coordinated protein expression within the VGCC family, coupling the channel function with VGCC C-terminal transcription factors.

Keywords: C-terminal proteins; CACNA1A; CACNA1C; CACNA1H; Ca2+ signaling; VGCC; Voltage-gated Ca2+ channels; bicistronic cellular genes; neuronal differentiation; synaptic function; α1ACT; α1CCT; α1HCT.


Conflict of interest statement

Author Declaration of Interests The authors declare no competing interests.

Figures

Figure 1.
Figure 1.. The VGCC gene family is bicistronic with C-terminal secondary proteins generated by all ten members and Subcellular localization of C-terminal secondary proteins expressed by ten VGCC cDNAs.
(A) Schematic representation of L type VGCC- CACNA1S, CACNA1C, CACNA1D, and CACNA1F -with STOP codon constructs. (B) Schematic representation of P/Q, N, R type VGCC- CACNA1A, CACNA1B, and CACNA1E - with STOP codon constructs. (C) Schematic representation of T type VGCC- CACNA1G, CACNA1H, and CACNA1I -with STOP codon constructs. (D, E, and F) Western blot analysis of C-terminally 3XFLAG-tagged L type (D), P/Q, N, R type (E), and T type (F) VGCCs showing a secondary protein product detected by 3XFLAG antibody, that is produced independently of the full-length channel (FL). Secondary products ~37–85 kDa were observed in both full length and STOP code conditions, while the primary VGCC alpha subunits (~250 kDa) were only observed in FL conditions. CaV1 sub-family (D), CaV2 sub-family (E), CaV3 sub-family (F). (G, H, and I) Representative confocal images of HEK293T cells transfected with either FL α1 VGCC subunit or STOP construct cDNA tagged with 3XFLAG (A, B, and C) and corresponding pie charts showing cellular compartment quantification of fluorescent signal for FL and STOP constructs in the CaV1 family (G), CaV2 family (H), and CaV3 family (I). Number of cells used for each quantification is shown. Scale bar (G, lower left) = 10 microns.
Figure 2.
Figure 2.. α1CCT and α1ACT translocate to or from the nucleus in response to elevated intracellular calcium.
(A) Representative images of fixed rat cortical neurons transfected with α1CCT mRNA and treated with 20mM KCl with or without BAPTA-AM. Fixed neurons were stained with DAPI (blue), MAP2 antibody(green), and 3XFLAG antibody (red). Scale bars = 10 microns. (B) Quantification of nuclear/cytosolic fluorescence signal of rat cortical neurons transfected with α1CCT mRNA with 20mM KCl with or without BAPTA-AM. (C) Quantification of nuclear/cytosolic fluorescence signal of rat cortical neurons transfected with α1CCT mRNA with different treatments. (D) Representative images of fixed rat cortical neurons transfected with α1ACT mRNA and treated with 20mM KCl with or without BAPTA-AM. Fixed neurons were stained with DAPI (blue), MAP2 antibody (green), and 3XFLAG antibody (red). Scale bars = 10 microns. (E) Quantification of nuclear/cytoplasmic fluorescence signal of rat cortical neurons transfected with α1ACT mRNA with 20mM KCl with or without BAPTA-AM. (F) Quantification of nuclear/cytosolic fluorescence signal of rat cortical neurons transfected with α1ACT mRNA with different treatments. (G) Representative live-cell images of rat cortical neurons infected with AAV9-EmGFP, AAV9- α1CCT-EmGFP, or AAV9- α1ACT-EmGFP virus at T = 0 seconds, T = 300 seconds, or T = 600 seconds post-glutamate uncaging. Circles denote the nucleus. Arrows denote putative nuclear speckle formation (α1CCT) or dissipation (α1ACT). Scale bars = 10 microns. Glutamate uncaging occurred at T = 15s with two 10ms pulses of 405 nm light. Images were collected every 3s for 10 minutes total. (H) Graph depicting intracellular calcium spike (as measured by Rhod2 ΔF/F0) versus neuronal nuclear fluorescence change at T = 600s (ΔF/F0) for EmGFP, α1CCT, α1ACT, and α1HCT infected neurons (N > 30 cells for each condition) (I) Normalized nuclear fluorescence ΔF/F0 for EmGFP, α1CCT, α1ACT, and α1HCT infected neurons at T=600s post-glutamate uncaging (N > 30 cells per condition, *p<0.05, **p<0.01, ***p<0.001).
Figure 3.
Figure 3.. Nuclear translocation of α1CCT and α1ACT is coupled to calcium signaling through L-type VGCCs or NMDA receptors and calmodulin.
(A) The calcium-channel antagonists used in conjunction with live-neuron glutamate uncaging. (B) Graph showing the comparison of α1CCT nuclear translocation following glutamate uncaging in the presence of L-type calcium channel antagonist (nifedipine), NMDA receptor antagonist (AP5), or calmodulin antagonist (W-7 hydrochloride). Negative control (-Glu) refer to Figure S2.

(C) Quantification of normalized nuclear ΔF/F0 at T = 600 seconds for α1CCT treatment conditions. (D) Graph showing the comparison of α1ACT nuclear translocation following glutamate uncaging in the presence of nifedipine, AP5, or W-7. Negative control (-Glu) refer to Figure S2. (E) Quantification of normalized nuclear ΔF/F0 at T = 600 seconds for α1ACT treatment conditions. (F) Input samples showing 3XFLAG-tagged α1CCT, α1ACT, and α1HCT expression in lysates from H293T cell transfected with pLVX (control), α1CCT, α1ACT, and α1HCT. Immunoblotting (IB) was performed with anti-3XFLAG antibody, and anti-GAPDH antibody as loading control. Negative control immunoprecipitation (IP) using unconjugated Sepharose beads, showing minimal non-specific binding of α1CCT, α1ACT, and α1HCT. Calmodulin-Sepharose IP demonstrating specific interaction of α1CCT and α1ACT with calmodulin. 3XFLAG-tagged proteins were detected in the pull-down fractions, confirming their binding to calmodulin. N > 30 cells per condition, *p<0.05, **p<0.01, ***p<0.001.
Figure 4.
Figure 4.. α1CCT, α1ACT, and α1HCT bind to genomic DNA in a Ca2+-dependent manner and alter chromatin accessibility independently of Ca2+ influx.
(A) α1CCT, α1ACT, and α1HCT putative DNA binding profile within ±3000bp relative to the transcription start site (TSS) of DEGs in both resting and depolarized cells. Heatmaps display the CUT&RUN signal intensity across target sites, with corresponding aggregate signal profiles (above). The intensity score was derived from the sequencing read coverage. (B) Venn diagrams indicate the limited overlaps in DEGs-associated genomic binding sites in resting and depolarized cells for α1CCT, α1ACT, and α1HCT. (C) Venn diagrams indicate overlaps in DEGs-associated genomic binding sites for α1CCT, α1ACT, and α1HCT in resting and depolarized cells, highlighting the unique binding patterns among the three CTPs. (D) α1CCT, α1ACT, and α1HCT affects chromatin accessibility distribution ±3000bp TSS in resting and depolarized cells. Heatmaps show chromatin accessibility as measured by ATAC-seq, with aggregate signal profiles, pLVX is control, shown in green (above). (E) Venn diagrams indicate the prominent overlaps in chromatin accessibility of DEG-regulatory regions between resting and depolarized cells induced by α1CCT, α1ACT, and α1HCT. (F) Venn diagrams illustrate the overlap in chromatin accessibility of chromatin-accessible DEG-regulatory regions among α1CCT, α1ACT, and α1HCT in resting and depolarized cells. Shared and unique regions emphasize their differential impacts on chromatin structure.
Figure 5.
Figure 5.. α1CCT, α1ACT, and α1HCT promote a genetic neural differentiation program in hNPCs by binding to DNA in a Ca2+ dependent manner.
(A) Volcano plots of RNA-seq DEGs, the qRT-PCR-verified DEGs are highlighted as two categories, either with regulatory binding sites from both CUT&RUN-seq and ATAC-seq, or from ATAC-seq only. (B) Distinct enriched GO terms for RNA-seq DEGs directly regulated by α1CCT, inferred by CUT&RUN-seq, in hNPCs stably expressing α1CCT, with or without 20 mM KCl treatment. (C) Top enriched GO terms for RNA-seq DEGs directly regulated by α1ACT, inferred by CUT&RUN-seq, in hNPCs stably expressing α1ACT, with or without 20 mM KCl treatment. (D) Distinct enriched GO terms for RNA-seq DEGs directly regulated by α1HCT, inferred by CUT&RUN-seq, in hNPCs stably expressing α1HCT, with or without 20 mM KCl treatment. (E, F, and G) Distinct enriched DNA motifs from CUT&RUN-seq binding sites with an RNA-seq DEG annotation, for α1CCT (E), α1ACT (F), and α1HCT (G) with and without 20mM KCl treatment.
Figure 6.
Figure 6.. α1CCT, α1ACT, and α1HCT promote neurite outgrowth in hNPCs, and α1CCT restores expression of critical neuronal genes in a conditional forebrain Cacna1c knockout mouse model.
(A) Representative images of hNPCs stably expressing C-terminal 3XFLAG tag-labeled α1CCT, α1ACT, or α1HCT co-stained with antibodies directed against the hNPC marker Nestin (green) or 3XFLAG (red). (B, C, and D) Quantification of neurites per cell, longest neurite per cell, and average neurite length (n > 30 cells, *p<0.05, **p<0.01, ***p<0.001).

(E) Schematic diagram showing the AAV-FLEX-EmGFP or AAV-FLEX-α1CCT-EmGFP viral vectors used for in vivo injections and the derived mouse models. (F) Validation qRT-PCR analysis of Cacna1c knockout and α1CCT re-expression using primers directed at the 5’ or 3’ ends of the gene, respectively. (G) qRT-PCR analysis of selected upregulated and downregulated DEGs identified through RNA-seq in microdissected mouse forebrain tissue N = 4–5 mice per condition, *p<0.05, **p<0.01, ***p<0.001

References

    1. Komuro H. & Rakic P. Intracellular Ca2+ fluctuations modulate the rate of neuronal migration. Neuron 17, 275–285, doi: 10.1016/s0896-6273(00)80159-2 (1996). - DOI - PubMed
    1. Darcy D. P. & Isaacson J. S. L-type calcium channels govern calcium signaling in migrating newborn neurons in the postnatal olfactory bulb. J Neurosci 29, 2510–2518, doi: 10.1523/JNEUROSCI.5333-08.2009 (2009). - DOI - PMC - PubMed
    1. Bortone D. & Polleux F. KCC2 expression promotes the termination of cortical interneuron migration in a voltage-sensitive calcium-dependent manner. Neuron 62, 53–71, doi: 10.1016/j.neuron.2009.01.034 (2009). - DOI - PMC - PubMed
    1. Best J. M. & Kamp T. J. Different subcellular populations of L-type Ca2+ channels exhibit unique regulation and functional roles in cardiomyocytes. J Mol Cell Cardiol 52, 376–387, doi: 10.1016/j.yjmcc.2011.08.014 (2012). - DOI - PMC - PubMed
    1. Neely A. & Hidalgo P. Structure-function of proteins interacting with the alpha1 pore-forming subunit of high-voltage-activated calcium channels. Front Physiol 5, 209, doi: 10.3389/fphys.2014.00209 (2014). - DOI - PMC - PubMed

Publication types

LinkOut - more resources