[Preprint]. 2025 May 14:rs.3.rs-6596747.
doi: 10.21203/rs.3.rs-6596747/v1.

Temporal and Context-Dependent Requirements for the Transcription Factor Foxp3 Expression in Regulatory T Cells

Affiliations

Temporal and Context-Dependent Requirements for the Transcription Factor Foxp3 Expression in Regulatory T Cells

Wei Hu et al. Res Sq. .

Update in

Abstract

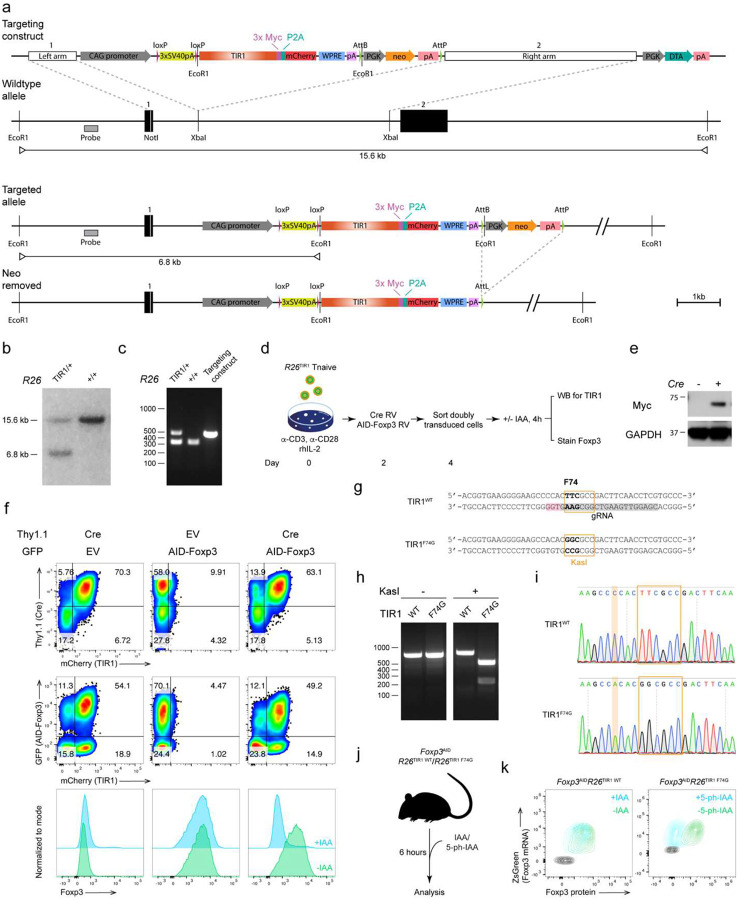
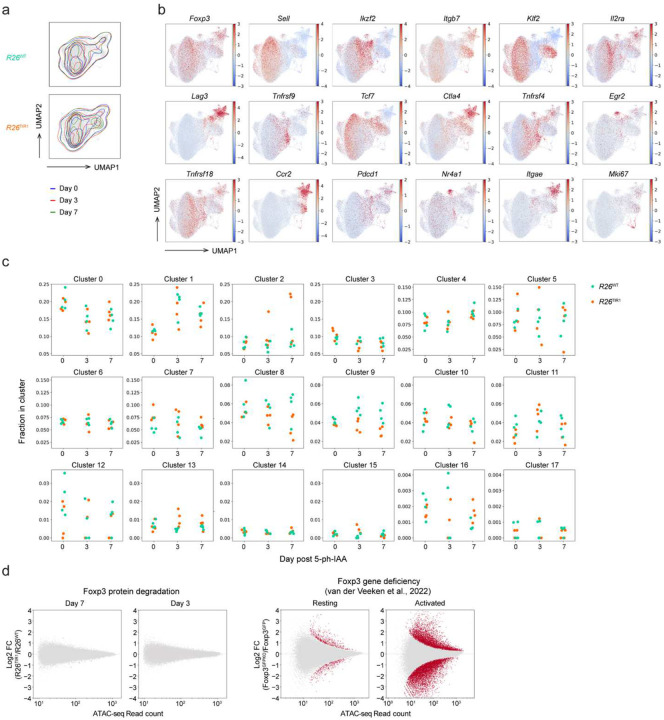
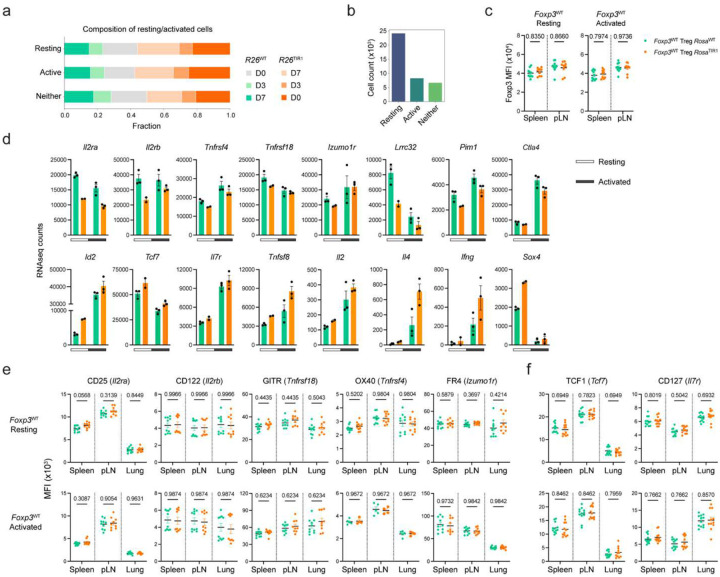
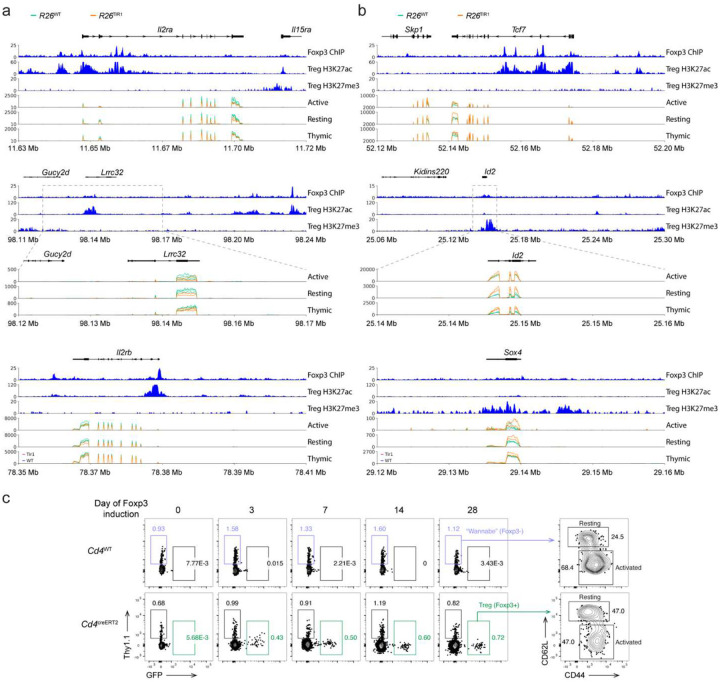
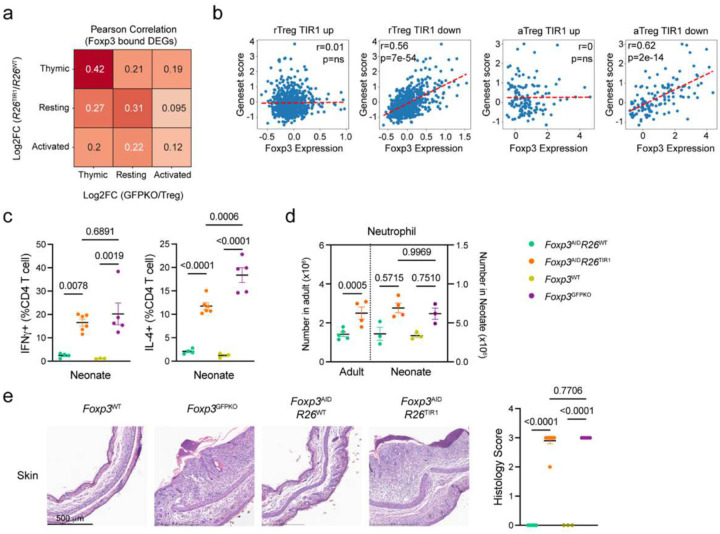
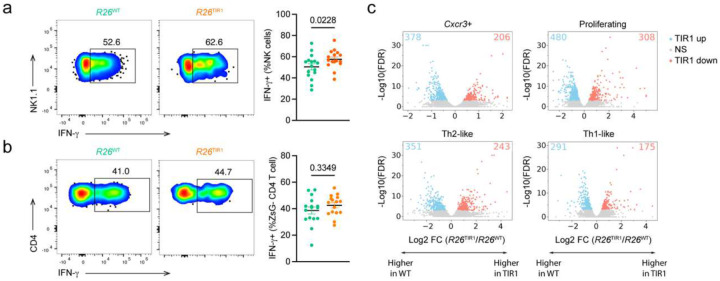
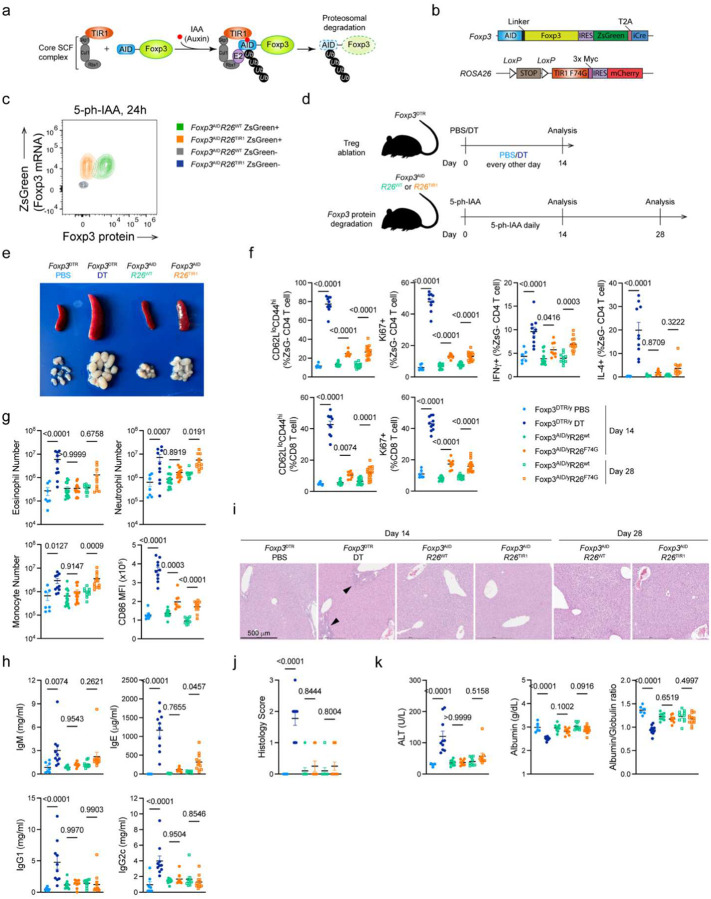
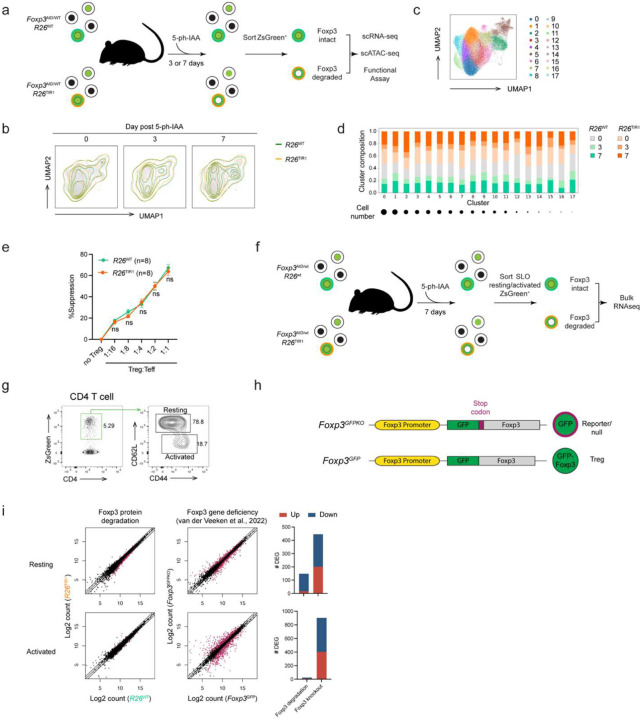
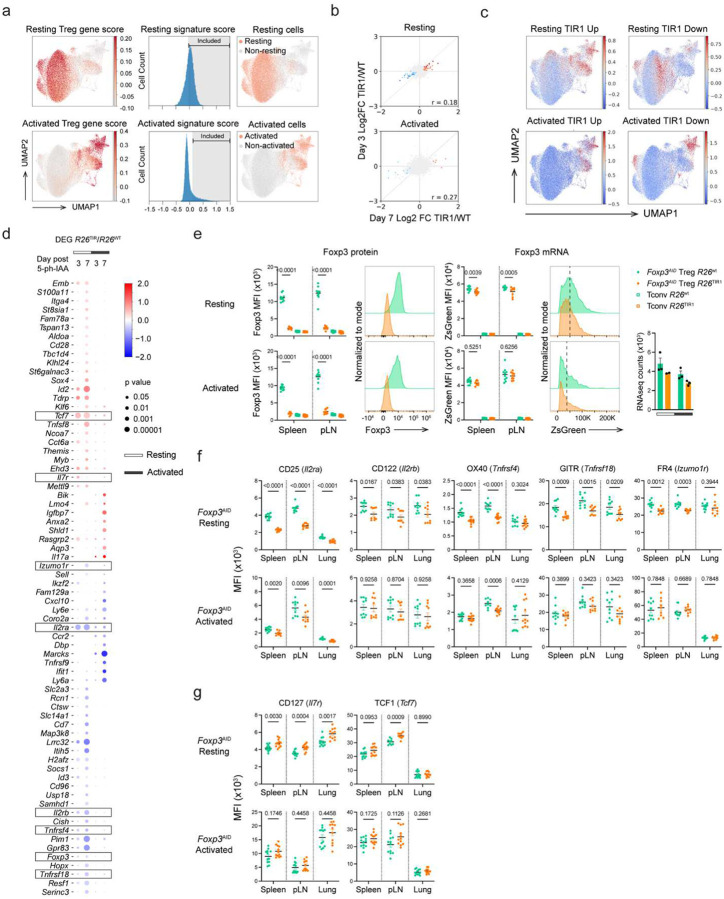
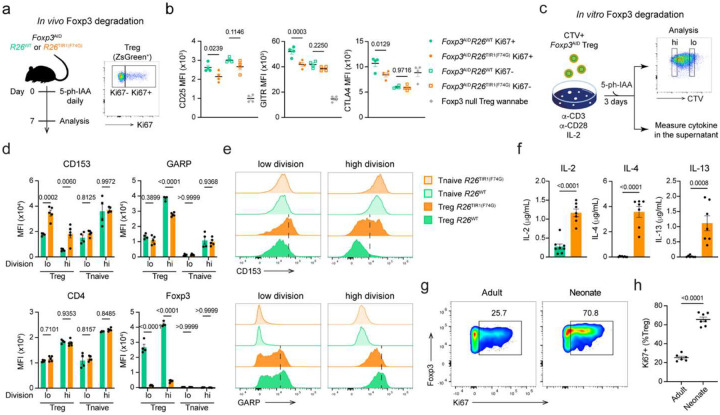
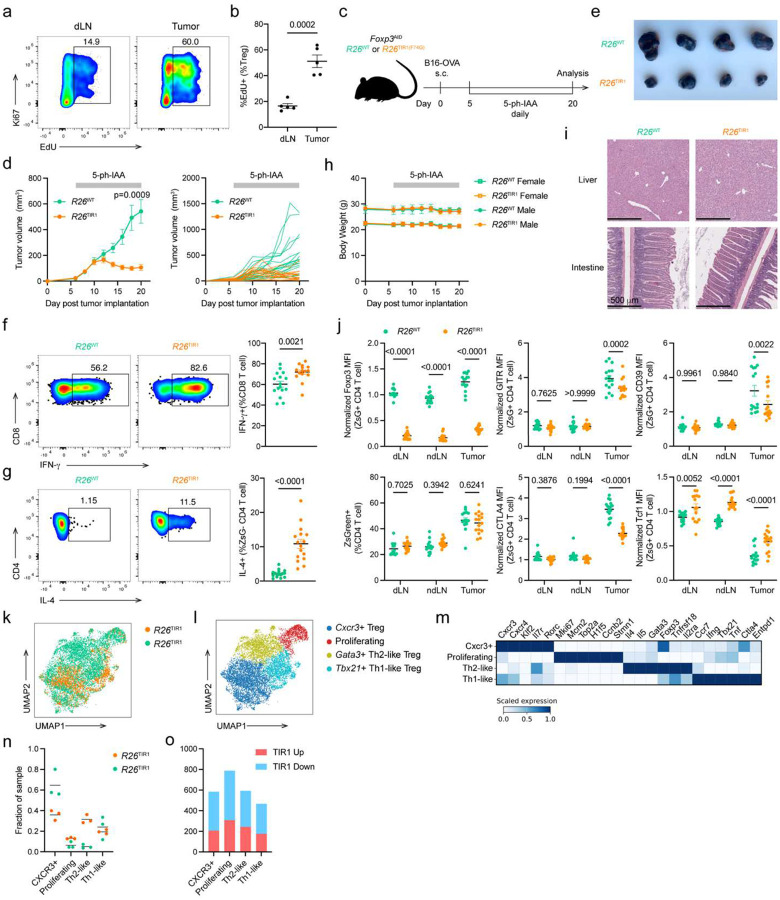
Regulatory T (Treg) cells, expressing the transcription factor Foxp3, are obligatory gatekeepers of the immune responsiveness. While Foxp3 essential role in Treg l differentiation is well established, the mechanisms by which Foxp3 governs the Treg-specific transcriptional network remain incompletely understood. Here, we employed a novel chemogenetic system of inducible, time-controlled degradation of Foxp3 protein in vivo to dissect its Treg stage stage-specific functions. While Foxp3 was indispensable for the establishment of the Treg transcriptional program and suppressive function during thymic Treg progenitors and newly generated peripheral Treg cells, degradation of Foxp3 in mature Treg cells resulted in unexpectedly minimal transcriptional changes largely limited to direct Foxp3 targets and largely preserved suppressive capacity. However, tumoral Treg cells were uniquely sensitive to Foxp3 degradation, which led to impaired suppressive function and tumor growth restraint absent pronounced adverse effects. These studies demonstrate context-dependent differential requirement for Foxp3 for Treg transcriptional and functional programs.


Conflict of interest statement

Conflict of interest A.Y.R. is an SAB member and has equity in Sonoma Biotherapeutics, RAPT Therapeutics, Coherus BioSciences, Santa Ana Bio, Odyssey Therapeutics, Nilo Therapeutics, and Vedanta Biosciences; he is also an SAB member of BioInvent and Amgen and a co-inventor of a CCR8+ Treg cell depletion IP licensed to Takeda, which is unrelated to the content of this publication. The remaining authors declare no competing interests. Z.-M. W. is an employee of Genentech Inc., which is unrelated to the content of this publication.

Figures

Extended Data Figure 1.
Extended Data Figure 1.. Generation of Foxp3AID mice.
(a) Gene targeting strategy. The auxin-inducible degron (AID) sequence was fused to the N-terminus of Foxp3 via a seven-amino acid flexible linker. An IRES-ZsGreen-T2A-iCre-Frt-neo-Frt cassette was inserted into the 3′ UTR. Arrows indicate the locations of PCR primers used to distinguish Foxp3WT and Foxp3AID alleles. IRES: internal ribosome entry sequence. iCre: codon improved Cre recombinase. PGK: PGK promoter. Neo: neomycin resistant gene. pA: bGH polyA sequence. (b) PCR validation of the knock-in allele. (c) Expression pattern of the ZsGreen reporter in Foxp3AID/WT heterozygous females. ZsGreen expression was restricted to CD25+ CD4 T cells, consistent with Foxp3 expression. (d) ZsGreen+ Foxp3AID Treg cells suppressed naïve CD4+ T cell proliferation comparably to Foxp3GFP Treg cells in vitro. Line graph represents mean ±SEM of two biological replicates. (e) Naïve CD4+ T cells from Foxp3AID mice were cultured under Treg inducing conditions and transduced with either a TIR1-encoding retrovirus or the empty vector control. AID-tagged Foxp3 protein was selectively degraded in TIR1-transduced induced Treg (iTreg) cells upon indole-acetic acid (IAA) treatment. Scatter plots represents mean ±SEM.
Extended Data Figure 2.
Extended Data Figure 2.. Generation of ROSA26TIR1 and ROSA26TIR1(F74G) mice.
(a) Gene targeting strategy. WPRE: Woodchuck hepatitis virus post-transcriptional regulatory element; DTA: Diphtheria toxin fragment A). (b) Southern blot validation of heterozygous ROSA26TIR1/+ mice using the hybridization probe shown in (a). (c) PCR validation of ROSA26TIR1/+ mice. (d–f) Naïve CD4+ T cells from ROSA26TIR1/+ mice were co-transduced with retroviruses expressing Cre and AID-Foxp3 (d). TIR1 expression was induced in a Cre-dependent manner (e), resulting in AID-Foxp3 degradation upon IAA treatment (f). (g) Guide RNA (gRNA) design for CRISPR-mediated F74-to-G mutation in TIR1. The gRNA seed sequence is shown in grey; the PAM sequence is in pink. The F74G mutation creates a KasI restriction site. (h–i) Validation of the F74G mutation by KasI digestion (h) and Sanger sequencing (i). (j–k) The TIR1 F74G mutation enables in vivo protein degradation in response to 5-ph-IAA.
Extended Data Figure 3.
Extended Data Figure 3.. Foxp3 protein degradation in adult lymphoreplete mice induces minimal immune activation.
(a) Size of the spleen and lymph nodes after 28 days of Foxp3 degradation. (b) Serum antibody levels following Treg ablation or Foxp3 degradation. (c-d) Representative H&E stain (c) and histology scores (d) of the skin following Treg ablation or Foxp3 degradation. Data are pooled from two independent experiments. Scatter blots represent mean ±SEM. One-way ANOVA.
Extended Data Figure 4.
Extended Data Figure 4.. Inducible Foxp3 gene knockout causes minimal immune activation in adult lymphoreplete mice.
(a) Experimental design. (b-c) Representative plot (b) and combined data (c) showing the efficiency of Foxp3 gene knockout. (d) Size of the spleen and lymph nodes after 14 days of inducible Foxp3 gene knockout. (e-g) T cell activation (e), serum antibody levels (f), and myeloid cell expansion (g) following 14 days of inducible Foxp3 gene knockout. (h) Representative H&E stain (left) and histology scores (right) of the skin, liver, and lung following 14 days of Treg ablation or Foxp3 degradation. Data are pooled from two independent experiments. Scatter blots represent mean ±SEM. One-way ANOVA.
Extended Data Figure 5.
Extended Data Figure 5.. Foxp3 degradation in developed Treg cells induces minimal gene expression and chromatin accessibility changes.
(a) UMAP visualization of scRNA-seq data from Foxp3AIDR26WT and Foxp3AIDR26TIR1(F74G) Treg cells on days 0, 3 and 7 of 5-ph-IAA–induced Foxp3 degradation. (b) UMAP visualization of representative genes from the single cell RNA-seq dataset colored by expression level. (c) Scatter plot showing the fraction of Foxp3AIDR26WT and Foxp3AIDR26TIR1(F74G) Treg cells in each cluster defined in Figure 2c. Data is summarized in Figure 2d. (d) MA plot showing differentially accessible ATAC-seq peaks induced by Foxp3 degradation (left) and Foxp3 gene deficiency (right).
Extended Data Figure 6.
Extended Data Figure 6.. Foxp3 degradation in developed Treg cells altered the expression of a small group of genes.
(a) The composition of Foxp3AIDR26WT and Foxp3AIDR26WT(F74G) Treg cells within resting and activated subsets from day 0, day 3, and day 7 of Foxp3 degradation. (b) Number of resting and activated Treg cells utilized for the differential gene expression analysis in Figure 3. (c) Flow cytometry analysis of Foxp3 protein and mRNA levels (reported by ZsGreen) in Foxp3WT Treg cells from heterozygous Foxp3AID/WTR26WT and Foxp3AID/WTR26TIR1(F74G) females after 7 days of Foxp3 degradation. Scatter plots represent mean ± SEM. Data are pooled from two independent experiments. Two-way ANOVA. (d) Bulk RNA-seq read counts of indicated genes in Foxp3AID Treg cells from heterozygous Foxp3AID/WTR26WT and Foxp3AID/WTR26TIR1(F74G) females after 7 days of Foxp3 degradation. Bar graphs represent mean ± SEM. (e) Flow cytometry analysis of CD25, CD122, OX40, GITR, and FR4 protein levels in Foxp3WT Treg cells from heterozygous Foxp3AID/WTR26WT and Foxp3AID/WTR26TIR1(F74G) females after 7 days of Foxp3 degradation. (f) Flow cytometry analysis of CD127 and TCF1 protein levels in Foxp3AID Treg cells from heterozygous Foxp3AID/WTR26WT and Foxp3AID/WTR26TIR1(F74G) females after 7 days of Foxp3 degradation. (e-f) Scatter plots represent mean ± SEM. Data are pooled from two independent experiments. Multiple t-tests.
Extended Data Figure 7.
Extended Data Figure 7.. Genes sensitive to Foxp3 degradation in mature Tregs are potentially enriched for direct Foxp3 targets.
(a–b) Representative tracks showing Foxp3 ChIP, Treg H3K27Ac, Treg H3K27me3, and RNA-seq profiles in activated, resting, and nascent thymic Treg cells for candidate Foxp3-activated (a) and Foxp3-repressed (b) genes. (c) Representative flow cytometry plots and gating strategy for RNA-seq analysis of Treg “wannabe” cells with or without Foxp3 induction at the indicated time points following 4-OHT administration.
Extended Data Figure 8.
Extended Data Figure 8.. Foxp3 is preferentially required during Treg cell development.
(a) Pearson correlation between Foxp3 degradation–induced and Foxp3-dependent DEGs in thymic, resting, and activated Treg cells, limited to Foxp3-bound genes. (b) Meta-cell analysis of resting and activated Treg scRNA-seq data from secondary lymphoid organs following Foxp3 degradation, correlating Foxp3 expression levels with “TIR1-up” and “TIR1-down” gene signatures identified in Figure 3. (c) Cytokine production by CD4+ T cells from neonatal Foxp3AID mice after 14 days of Foxp3 degradation, in comparison to age-matched Foxp3WT and Foxp3GFPKO mice. (d) Neutrophil expansion in adult and neonatal Foxp3AID mice following 14 days of Foxp3 degradation. Age-matched Foxp3WT and Foxp3GFPKO mice serve as controls for neonatal Foxp3AID mice. (e) Representative H&E staining and histology scores of skin inflammation in neonatal Foxp3AID mice after 14 days of Foxp3 degradation, in comparison to age-matched Foxp3WT and Foxp3GFPKO mice. (c–e) Scatter plots represent mean ± SEM; data are pooled from two independent experiments. One-way ANOVA.
Extended Data Figure 9.
Extended Data Figure 9.. Foxp3 degradation leads to tumor shrinkage with minimal adverse effects.
(a) Representative flow cytometry plots (left) and combined data (right) of IFN-γ production by tumor-infiltrating NK cells. Scatter plot shows mean ± SEM. Data are pooled from two independent experiments. Two-tailed t-test. (b) Representative flow cytometry plots (left) and quantification (right) of IFN-γ production by tumor-infiltrating ZsGreen CD4 T cells. Scatter plot shows mean ± SEM. Data are pooled from two independent experiments. Two-tailed t-test. (c) Volcano plts showing the number of genes up- and down-regulated in Foxp3AIDR26TIR1(F74G) tumor Treg cells within each clustered defined in Figure 7(l).
Figure 1.
Figure 1.. Foxp3 degradation causes minimal immune activation in adult lymphoreplete mice.
(a) Schematic of the inducible Foxp3 protein degradation model. (b) Schematic of the Foxp3AID and R26TIR alleles. (c) Flow cytometry plot showing 5-ph-IAA induced Foxp3 protein degradation. (d) Experimental design. (e) Size of spleen and lymph nodes after 14 days of Treg ablation or Foxp3 degradation. (f) Activation, proliferation, and cytokine production of CD4 (upper) and CD8 (lower) T cells following Treg ablation or Foxp3 degradation. (g) Number of eosinophils, neutrophils, monocytes, and CD86 levels on dendritic cells following Treg ablation or Foxp3 degradation. (h) Serum antibody levels following Treg ablation or Foxp3 degradation. (i-j) Representative H&E stain (i) and histology scores (j) of the liver following Treg ablation or Foxp3 degradation. (k) Liver damage measured by serum ALT, albumin, and albumin/globulin ratio. Scatter plots represent mean ± SEM. Data are pooled from two independent experiments. One-way ANOVA.
Figure 2.
Figure 2.. Foxp3 degradation induces minimal gene expression and functional changes in mature Treg cells.
(a) Experimental design of single-cell RNA-seq, ATAC-seq, and functional assays. Each genotype and time point consisted of four independent biological replicates. (b) UMAP visualization of scRNA-seq data from Foxp3AIDR26WT and Foxp3AIDR26TIR1(F74G) Treg cells before and 3 or 7 days after 5-ph-IAA–induced Foxp3 degradation. (c) UMAP visualization of the same scRNA-seq data, colored by identified clusters. (d) Proportions of Foxp3AIDR26WT and Foxp3AIDR26TIR1(F74G) Treg cells from each time point within each cluster. (e) In vitro suppression assay of Treg cells sorted from Foxp3AIDR26WT and Foxp3AIDR26TIR1(F74G) mice after 7 days of in vivo 5-ph-IAA treatment. 5-ph-IAA was included in culture to sustain Foxp3 degradation. Line graph represents mean ± SEM. Data are pooled from two independent experiments, multiple t-tests. (f) Experimental design of the bulk RNA-seq analysis. Each genotype and time point consisted of three independent biological replicates. (g) Gating strategy for sorting resting and activated Treg cells. (h) Schematic comparison of the Foxp3GFPKO reporter null allele and the functional Foxp3GFP allele. (i) Scatter plots and bar graphs showing the number of differentially expressed genes in resting or activated Treg cells caused by Foxp3 protein degradation or genetic Foxp3 deficiency.
Figure 3.
Figure 3.. Foxp3 degradation in mature Treg cells induces expression changes in a limited set of genes.
(a) Treg cells from the scRNA-seq dataset were classified as resting or activated based on exceeding the threshold for resting or activated gene signature scores and were subsequently analyzed. (b) Scatter plot showing the correlation of gene expression changes induced by Foxp3 degradation at day 3 and day 7 in resting and activated Treg cells. (c) UMAP visualization of resting and activated Treg cells colored by gene signature scores for the “TIR1-up” and “TIR1-down” gene sets, up- and downregulated upon Foxp3 degradation, respectively. Data are pooled from two independent experiments. One-way ANOVA. (d) Dot plot summarizing statistically significant differentially expressed genes in resting or activated Treg cells following 3 or 7 days of 5-ph-IAA–induced Foxp3 degradation. (e) Flow cytometry analysis of Foxp3 protein and mRNA levels (reported by ZsGreen) in Foxp3AID Treg cells from heterozygous Foxp3AID/WTR26WT and Foxp3AID/WTR26TIR1(F74G) females after 7 days of Foxp3 degradation. Scatter plots represent mean ± SEM. Data are pooled from two independent experiments. Two-way ANOVA. (f) Flow cytometry analysis of CD25, CD122, OX40, GITR, and FR4 protein levels in Foxp3AID Treg cells from heterozygous Foxp3AID/WTR26WT and Foxp3AID/WTR26TIR1(F74G) females after 7 days of Foxp3 degradation. (g) Flow cytometry analysis of CD127 and TCF1 protein levels in Foxp3AID Treg cells from heterozygous Foxp3AID/WTR26WT and Foxp3AID/WTR26TIR1(F74G) females after 7 days of Foxp3 degradation. (f-g) Scatter plots represent mean ± SEM. Data are pooled from two independent experiments. Multiple t-tests.
Figure 4.
Figure 4.. Foxp3 degradation-sensitive genes in mature Treg cells are enriched for Foxp3 binding.
(a) Bar graphs showing the proportion of ATAC-seq peaks near Foxp3 degradation-induced differentially expressed genes (DEGs) bound by Foxp3. Genes are stratified by statistical significance (p-values) in resting and activated Treg cells. (b) Bar graphs showing the proportion of ATAC-seq peaks near Foxp3-dependent bound by Foxp3. Genes are stratified by p-values in resting and activated Treg cells. (c) H3K27Ac and H3K27me3 ChIP-seq signals at Foxp3-bound ATAC-seq peaks near Foxp3 degradation–induced DEGs. (d) Dot plot showing transcription factor motif enrichment within Foxp3-bound regions near Foxp3 degradation–induced DEGs. (e) Schematic diagram illustrating the “on” and “off” states of the reversible reporter-null Foxp3LSL allele. (f) Experimental design of the gain-of-function experiment to induce Foxp3 expression in Treg “wannabe” cells. Each genotype and time point consisted of two independent biological replicates. (g) Line graph depicting gene expression changes across different time points following Foxp3 induction in Treg “wannabe” cells.
Figure 5.
Figure 5.. Foxp3 is preferentially required during early Treg cell development.
(a) Experimental design for transcriptional profiling of developing thymic Treg cells. Each genotype consisted of three independent biological replicates. (b) Gating strategy used to sort CD73− nascent thymic Treg cells. (c) Bar graph comparing the number of Foxp3 degradation–induced DEGs in thymic, resting, and activated Treg cells. (d) Pearson correlation between Foxp3 degradation–induced and Foxp3-dependent DEGs in thymic, resting, and activated Treg cells. (e) Scatter and cumulative distribution function (CDF) plots comparing Foxp3 degradation–induced and Foxp3-dependent DEGs across the three Treg populations. (f) Meta-cell analysis of thymocyte scRNA-seq data correlating Foxp3 expression levels with the expression of TIR1-up and TIR1-down gene signatures identified in (a–c). UMAP plots are colored by expression levels of the TIR1-up, TIR1-down signatures, and Foxp3. (g) Experimental design for in vivo Foxp3 degradation in 1-day-old neonatal Foxp3AID mice. (h) CD4 and CD8 T cell activation in adult and neonatal Foxp3AID mice following Foxp3 degradation. (i) Expansion of eosinophils and neutrophils in adult and neonatal Foxp3AID mice after Foxp3 degradation. (j–k) Representative H&E staining (j) and histology scores of liver inflammation (k) in neonatal Foxp3AID mice following Foxp3 degradation. (l) In vitro suppression assay of Treg cells sorted from Foxp3AIDR26WT and Foxp3AIDR26TIR1(F74G) neonatal mice after 7 days of in vivo 5-ph-IAA administration. 5-ph-IAA was also included in culture to maintain Foxp3 degradation. (h–l) Data are pooled from two independent experiments. Scatter plots represent mean ± SEM. one-way ANOVA. (m) Bar graphs summarizing the number of Foxp3 degradation–induced DEGs in Treg cells from neonatal and adult Foxp3AID mice. (n) Scatter plot correlating gene expression changes induced by Foxp3 degradation and Foxp3 gene deficiency in neonatal mice. (o) Scatter plots comparing gene expression changes induced by Foxp3 degradation in neonatal Treg cells to those in adult thymic, resting, and activated Treg cells.
Figure 6.
Figure 6.. Dividing Treg cells are more reliant on Foxp3 for Treg specific gene expression.
(a) Experimental design of proliferating Treg analysis in vivo. (b) Flow cytometry analysis of CD25, GITR, and CTLA4 protein levels in dividing versus non-deviding Treg cells following 7 days of in vivo Foxp3 degradation, in comparison to Foxp3-deficient Treg “wannabe” cells. Scatter plots represent mean ± SEM. Data are representative of two independent experiments. One-way ANOVA. (c) Experimental design of proliferating Treg cell analysis in vitro. (d-e) Combined data (d) and representative plots showing CD153, GARP, CD4, and Foxp3 protein levels in lowly and highly divided Treg cells. Similarly treated naïve CD4 T cells serve as Foxp3 controls. Bargraphs represent mean ± SEM. Data are representative of two independent experiments. Two-way ANOVA. (f) IL-2, IL-4, and IL-13 concentrations in the supernatant of in vitro proliferating Treg assay. Bargraphs represent mean ± SEM. Data are pooled from two independent experiments. Two-tailed t test. (g-h) Representative plots (g) and combined data (h) showing Treg proliferation in 8-week-old adult versus 7-day-old neonatal mice measured by Ki67 positivity. Scatter plot represents mean ± SEM. Data are combined from two independent experiments. Two-tailed t test.
Figure 7.
Figure 7.. Foxp3 degradation leads to tumor shrinkage with minimal adverse effects.
(a–b) Representative flow cytometry plots (a) and combined data (b) of Ki67 expression and EdU incorporation in Treg cells from the tumor and tumor-draining lymph node (dLN). Scatter plot shows mean ± SEM. Data are representative of two independent experiments. Two-tailed t-test. (c) Schematic of the tumor experiment design. (d) Tumor burden over time, shown as average (left) and individual (right) tumor growth curves. Line graph represents mean ± SEM. Data are pooled from two independent experiments. Two-way ANOVA (mixed-effects model) with Geisser-Greenhouse correction. (e) Representative tumor images on day 20. (f) Representative flow cytometry plots (left) and combined data (right) of IFN-γ production by tumor-infiltrating CD8 T cells. Scatter plot shows mean ± SEM. Data are pooled from two independent experiments. Two-tailed t-test. (g) Representative flow cytometry plots (left) and quantification (right) of IL-4 production by tumor-infiltrating ZsGreen− CD4 T cells. Scatter plot shows mean ± SEM. Data are pooled from two independent experiments. Two-tailed t-test. (h) Body weight monitoring throughout the experiment. Line graph shows mean ± SEM. Data are pooled from two independent experiments. (i) H&E staining of liver and intestine on day 20. (j) Expression levels of Foxp3, GITR, CD39, ZsGreen, CTLA-4, and Tcf1 in ZsGreen+ CD4 T cells from the dLN, non-draining lymph node (ndLN), and tumor on day 20. Scatter plots show mean ± SEM. Data are pooled from two independent experiments. Multiple t-tests. (k–l) UMAP visualization of scRNAseq analysis of tumor Treg cells from Foxp3AIDR26WT and Foxp3AIDR26TIR1(F74G) mice on day 14 after tumor implantation, colored by genotype (k) or cluster (l). (m) Heatmap showing gene expression profiles of each cluster in (l). (n) Proportional distribution of Foxp3AIDR26WT and Foxp3AIDR26TIR1(F74G) Treg cells within each cluster in (l). (o) Number of DEGs between Foxp3AIDR26WT and Foxp3AIDR26TIR1(F74G) Treg cells in each cluster shown in (l).

References

    1. Fontenot J.D., Gavin M.A. & Rudensky A.Y. Foxp3 programs the development and function of CD4+CD25+ regulatory T cells. Nat Immunol 4, 330–336 (2003). - PubMed
    1. Hori S., Nomura T. & Sakaguchi S. Control of regulatory T cell development by the transcription factor Foxp3. Science 299, 1057–1061 (2003). - PubMed
    1. Khattri R., Cox T., Yasayko S.A. & Ramsdell F. An essential role for Scurfin in CD4+CD25+ T regulatory cells. Nat Immunol 4, 337–342 (2003). - PubMed
    1. Gavin M.A. et al. Foxp3-dependent programme of regulatory T-cell differentiation. Nature 445, 771–775 (2007). - PubMed
    1. Lin W. et al. Regulatory T cell development in the absence of functional Foxp3. Nat Immunol 8, 359–368 (2007). - PubMed

Publication types

LinkOut - more resources