[Preprint]. 2025 May 13:rs.3.rs-6573757.
doi: 10.21203/rs.3.rs-6573757/v1.

Extracellular Vesicle Profiling Reveals Novel Autism Signatures in Patient-Derived Forebrain Organoids

Affiliations

Extracellular Vesicle Profiling Reveals Novel Autism Signatures in Patient-Derived Forebrain Organoids

Isidora Stankovic et al. Res Sq. .

Abstract

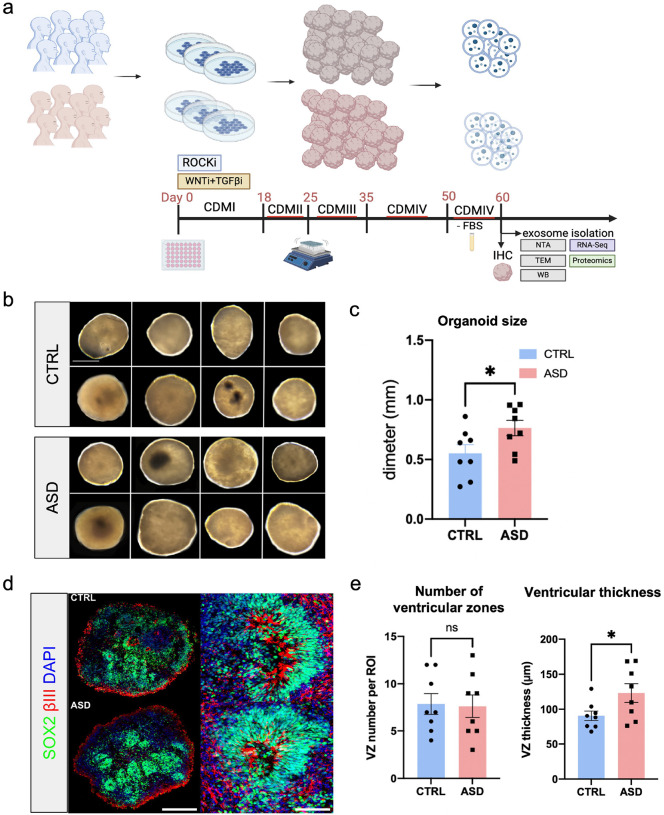
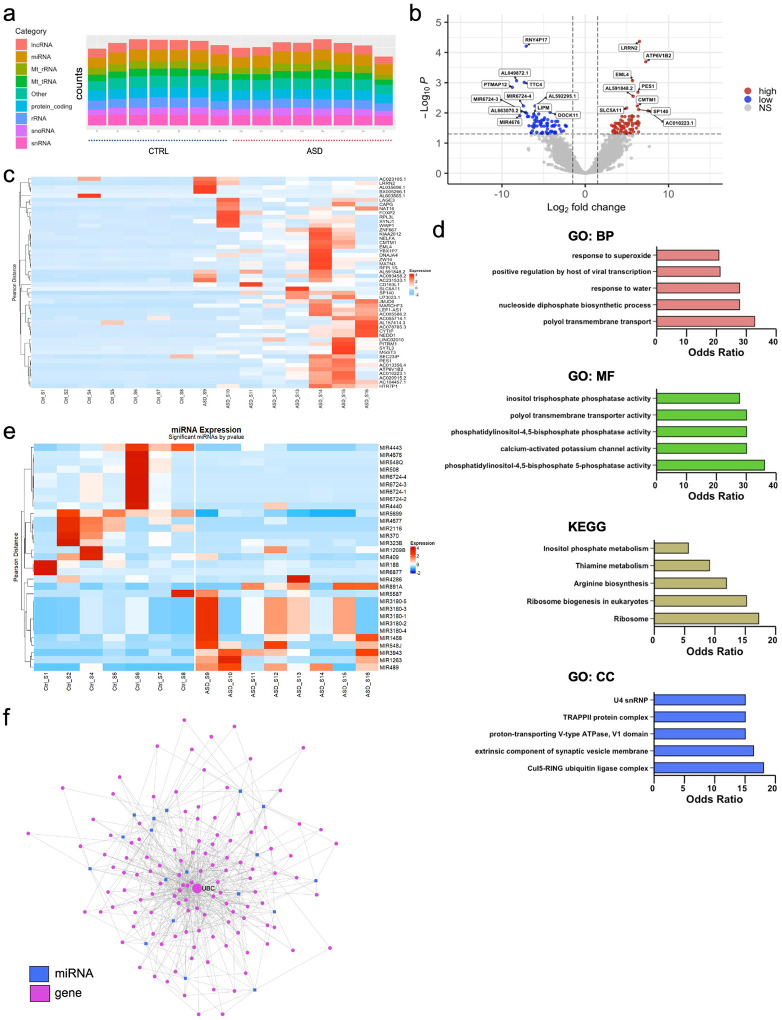
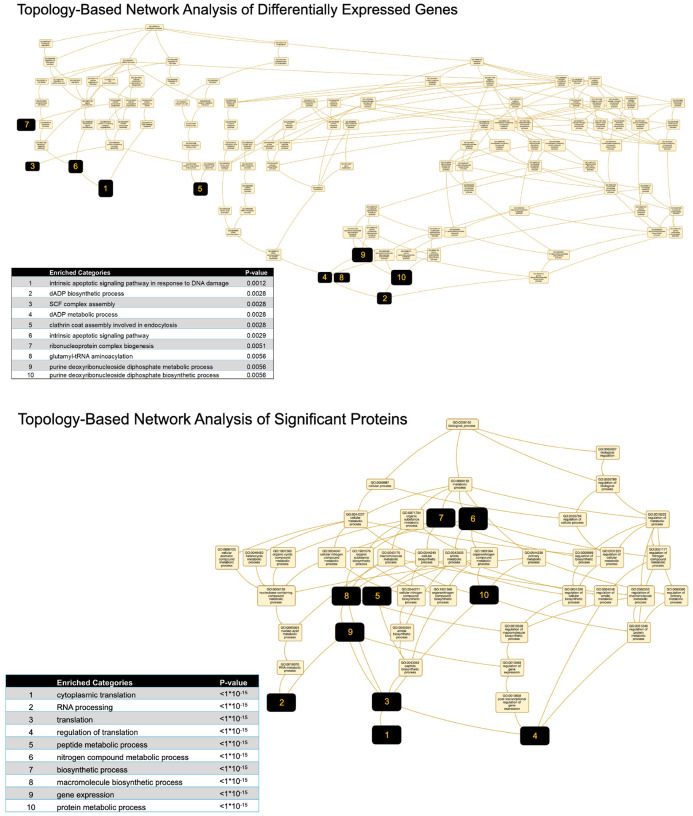
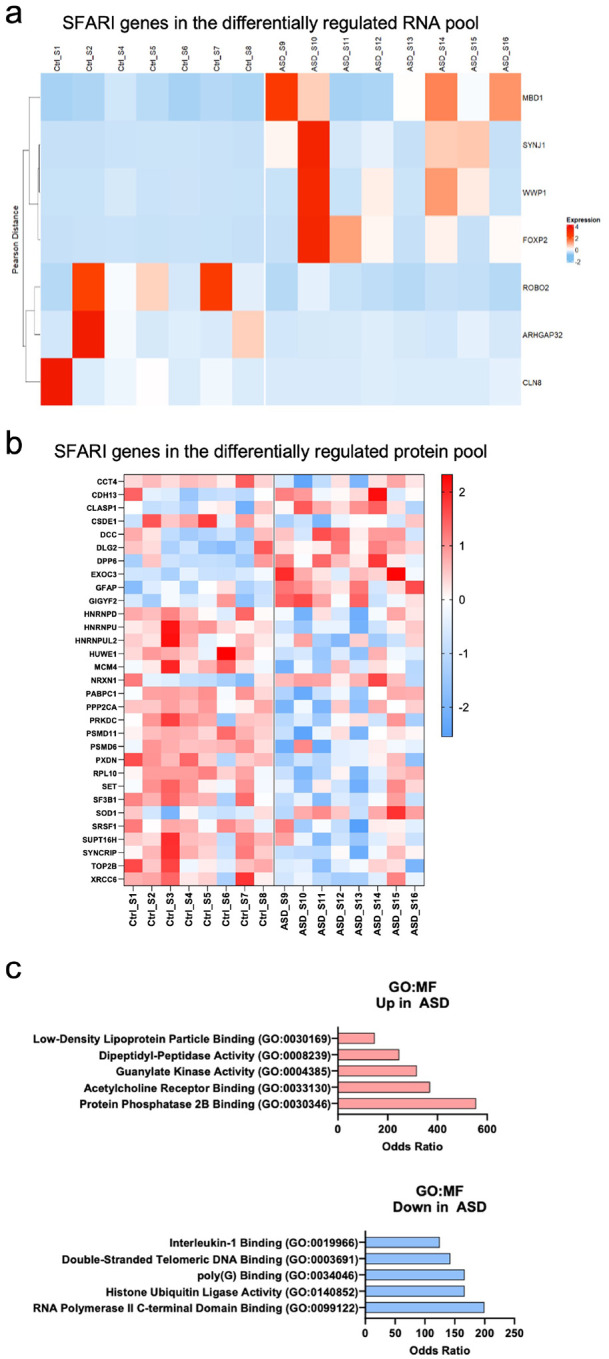
Autism Spectrum Disorder (ASD) affects 1 percent of the world's population with an increased prevalence of 178 percent since 2000. Although altered synaptic function putatively accounts for many of the abnormalities seen in ASD, the specific molecular mechanisms underlying this disorder remain poorly defined. A growing body of evidence suggests that extracellular vesicles (EVs), specifically exosomes, play a critical role in cellular communication within the brain. While they have been implicated in various types of diseases from cancer to neurodegeneration, their involvement in ASD remains largely unexplored. In this study, we utilized patient-derived cortical organoid models to characterize EVs secreted by human three-dimensional (3D) tissue and defined their cargo. Our study reports, for the first time, alterations in ASD organoid-derived EVs in comparison to healthy control cortical EVs. By utilizing small RNA sequencing, proteomics, nanoparticle tracking and microscopy, we provide a comprehensive characterization of the cargo carried by EVs secreted from human 3D forebrain models. Our findings reveal substantial differences both in the RNA and protein content of ASD-derived EVs, providing insight into disease mechanisms as well as highlighting the potential of exosome-based diagnostics and therapies for ASD.


Conflict of interest statement

Conflict of interest statement The authors report no conflict of interest or commercial interests related to the manuscript. Additional Declarations: The authors have declared there is NO conflict of interest to disclose

Figures

Figure 1.
Figure 1.. Forebrain organoids generated from iPSC lines derived from healthy controls and individuals with ASD
a) Schematic depicting experimental design and timeline. Briefly, forebrain organoids were generated using a previously described protocol (59). At 60 DIV, media was collected, and EVs were isolated, followed by subsequent analysis. b) Light microscopy images of representative brain organoids at 60 DIV from all 16 lines used in the study. c) Bar graph depicts average size of organoids derived from CTRL and ASD lines (n = 8 lines per group; n = 3 organoids per line). d) Representative images of SOX2 (green), β-III-tubulin (red) and DAPI (blue) immunostaining in CTRL and ASD organoids to assess proliferative and neurogenic zones. e) Quantifications of ventricular-like zone density and thickness across 16 organoid lines used in the study (n = 8 lines per group; n = 3–10 organoids per line). Scale bar = 0.25 mm for b; 500 μm for d. Data is represented as mean ± SEM, p < 0.05.
Figure 2.
Figure 2.. Exosome abundance in organoid-derived EVs
a) Schematic of exosome validation methods. EVs were isolated from maintenance media of CTRL and ASD dorsal forebrain organoids at 60 DIV using a combination of Exo-isolation kit and centrifugation. EVs were then resuspended in either RIPA or PBS buffers, depending on downstream analysis. b) Representative Western blot examples in pellet and supernatant samples. Only pellets, not supernatant, were positive for exosome markers (CD9, CD63) indicating high efficiency in EV isolation. c) Representative graphs of nanoparticle tracking analysis (NTA). The x-axis represents concentration (particles/mL), and the y-axis represents particle size (nm). The top four are representative plots from CTRL lines while the bottom four plots are representative examples from ASD lines. The peaks typically appeared in the < 200nm range, representative of exosome size. d) Bar graphs depicting no significant difference in either average particle size or concentration between CTRL and ASD EVs at the NTA analysis. Each point on the graph represents an independent cell line. Data are represented as mean ± SEM. e) Representative TEM images of EVs isolated from CTRL and ASD organoid media. Vesicles typically displayed a canonical exosome cup/rose shape and size.
Figure 3.
Figure 3.. Differentially regulated RNAs point to translational control and ubiquitin activity in ASD EVs
a) RNA counts by category per ASD and CTRL sample (n = 16 samples). b) Volcano plot displaying significantly expressed genes. Thresholds of significance used included Log2 FC > +/−1.5 and adjusted log10 Benjamini-Hochberg corrected p < +/− 0.05. c) Hierarchical and K-means heatmap of the top 50 differentially expressed RNAs in each sample (see supplementary materials for the full list of differentially regulated RNAs). d) Bar graph of GSEA enrichment terms from the respective pathway database. Terms ordered by descending odds ratio. Significant GSEA categories include i) Gene Ontology: Biological Processes (BP), ii) KEGG Kyoto Encyclopedia of Genes and Genomes, iii) Gene Ontology: Molecular Function (MF), iv) Gene Ontology: Cellular Component (CC). e) Hierarchical and K-means heatmap of the top 31 differentially expressed miRNAs in each sample; p < 0.05. f) miRNA–gene interaction network and hub gene analysis. Node size corresponds to the degree of connectivity, with larger nodes indicating higher numbers of interactions.
Figure 4.
Figure 4.. Altered protein expression comprises translation and protein degradation related categories in ASD EVs
a) Protein counts by category per ASD and CTRL sample (n = 16 samples). b) Volcano plot displaying proteins expressed significantly. Thresholds of significance used included Log2 FC > +/− 1.5 and adjusted log10 Benjamini-Hochberg corrected p < 0.05. c) Coefficient of variance in CV and ASD lines, (n = 16 samples), non-significant. d) Clustered heatmap of 362 significant proteins based on a Student T-test analysis (p < 0.05). Values based on z-score normalization. e) Gene ontology analysis of significant proteins using enrichR. Top 10 categories selected (p < 0.05); odds ratio observed between ASD and CTRLs. Terms ordered by descending odds ratio. Significant GSEA categories include i) Gene Ontology: Biological Processes (BP), ii) KEGG Kyoto Encyclopedia of Genes and Genomes, iii) Gene Ontology: Molecular Function (MF), iv) Gene Ontology: Cellular Component (CC).
Figure 5.
Figure 5.. Altered pathways predicted by network analysis in ASD EVs
Topology-based network enrichment analysis of differentially expressed genes and proteins in ASD-derived EVs. Top: Gene network analysis revealed 10 significantly enriched categories, including apoptosis, GDP metabolism, and clathrin-mediated endocytosis (p < 0.01). Bottom: Protein network analysis identified highly interconnected enrichment in translation, RNA processing, and biosynthetic pathways (p < 1×10⁻¹⁵). Node size reflects the degree of connectivity within the GO network.
Figure 6.
Figure 6.
Differentially regulated RNAs and proteins in ASD EVs include ASD risk genes a) Heatmap of the significant SFARI genes among the differentially expressed mRNAs in each group. Values based on z-score normalization (p < 0.05). b) Heatmap of the significant SFARI genes among the differentially expressed proteins. Values based on z-score normalization (p < 0.05). c) enrichR gene ontology analysis of the significant SFARI risk genes among the differentially expressed proteins in ASD EVs. Top categories selected (p < 0.05); odds ratio observed between ASD and CTRL.

References

    1. Ramaswami G., & Geschwind D. H. (2018). Genetics of autism spectrum disorder. In Handbook of clinical neurology (Vol. 147, pp. 321–329). - PubMed
    1. Straiton D., Pomales-Ramos A., & Broder-Fingert S. (2024). Health equity and rising autism prevalence: Future research priorities. Pediatrics, 154(4), e2023064262. 10.1542/peds.2023-064262 - DOI - PMC - PubMed
    1. Rylaarsdam L., & Guemez-Gamboa A. (2019). Genetic causes and modifiers of autism spectrum disorder. Frontiers in Cellular Neuroscience, 13, 385. 10.3389/fncel.2019.00385 - DOI - PMC - PubMed
    1. Gentilini D., Cavagnola R., Possenti I., Calzari L., Ranucci F., Nola M., Olivola M., Brondino N., & Politi P. (2023). Epigenetics of autism spectrum disorders: A multi-level analysis combining epi-signature, age acceleration, epigenetic drift, and rare epivariations using public datasets. Current Neuropharmacology, 21(11), 2362–2373. 10.2174/1570159X21666230725142338 - DOI - PMC - PubMed
    1. Saeliw T., Permpoon T., Iadsee N., et al. (2022). LINE-1 and Alu methylation signatures in autism spectrum disorder and their associations with the expression of autism-related genes. Scientific Reports, 12, 13970. 10.1038/s41598-022-18232-6 - DOI - PMC - PubMed

Publication types

LinkOut - more resources