

This is a preprint.
Detection of Cortical Arousals in Sleep Using Multimodal Wearable Sensors and Machine Learning
- PMID: 40470241
- PMCID: PMC12136197
- DOI: 10.21203/rs.3.rs-6574148/v1
Detection of Cortical Arousals in Sleep Using Multimodal Wearable Sensors and Machine Learning
Abstract
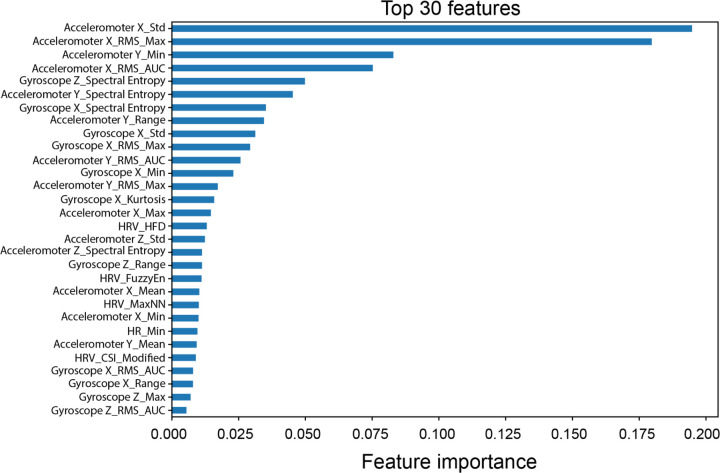
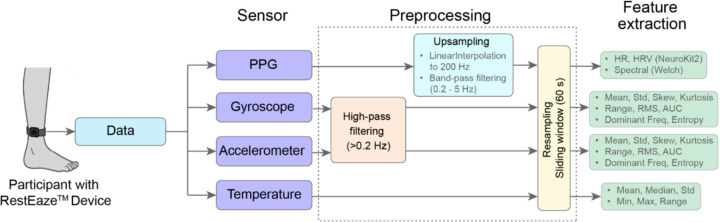
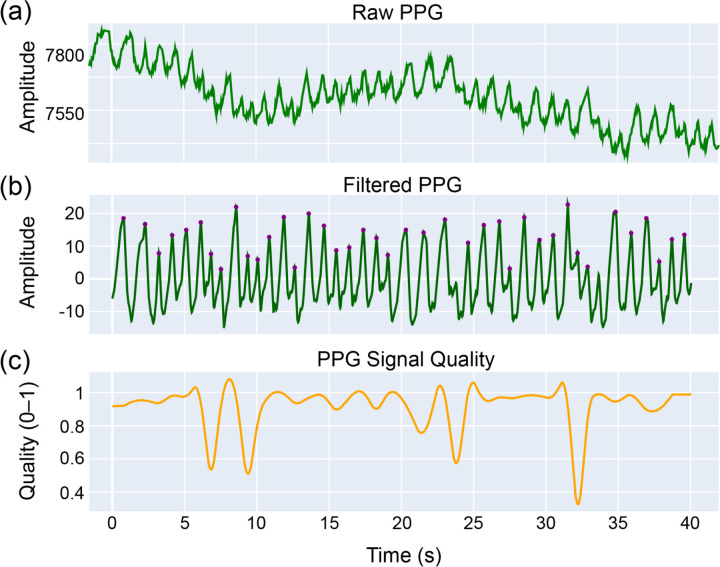
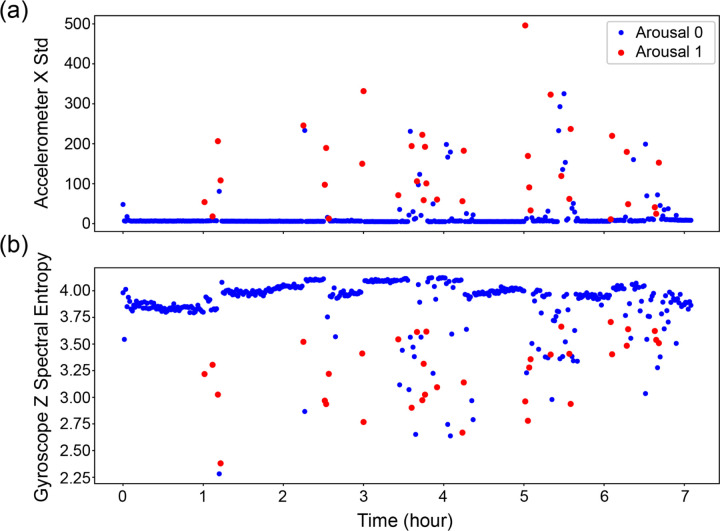
Cortical arousals are brief brain activations that disrupt sleep continuity and contribute to cardiovascular, cognitive, and behavioral impairments. Although polysomnography is the gold standard for arousal detection, its cost and complexity limit use in long-term or home-based monitoring. This study presents a noninvasive machine learning based framework for detecting cortical arousals using the RestEaze™ system, a leg-worn wearable that records multimodal physiological signals including accelerometry, gyroscope, photoplethysmography (PPG), and temperature. Across multiple methods tested, including logistic regression, XGBoost, and Random Forest classifiers, we found that features related to movement intensity were the most effective in identifying cortical arousals, while heart rate variability had a comparatively lower impact. The framework was evaluated in 14 children with attention-deficit/hyperactivity disorder (ADHD) who were being assessed for possible restless leg syndrome related sleep disruption. The Random Forest model achieved the best performance, with a ROC AUC of 0.94. For the arousal class specifically, it reached a precision of 0.57, recall of 0.78, and F1-score of 0.65. These findings support the feasibility of wearable-based machine learning for real-world arousal detection, demonstrated here in a pediatric ADHD cohort with sleep-related behavioral concerns.
Keywords: ADHD; RestEaze; cortical arousals; machine learning; sleep monitoring; wearables.
Conflict of interest statement
Competing Interests JB, CF, and NB are shareholders of Tanzen Medical Inc. All other authors have no competing interests.
Figures
References
-
- Morgan B. J. et al. Neurocirculatory consequences of abrupt change in sleep state in humans. J. Appl. Physiol. 80, 1627–1636 (1996). - PubMed
-
- Xue Y. et al. Durative sleep fragmentation with or without hypertension suppress rapid eye movement sleep and generate cerebrovascular dysfunction. Neurobiol. Dis. 184, 106222 (2023). - PubMed
-
- Chouchou F. et al. Sympathetic overactivity due to sleep fragmentation is associated with elevated diurnal systolic blood pressure in healthy elderly subjects: the PROOF-SYNAPSE study. Eur. Heart J. 34, 2122–2131 (2013). - PubMed
-
- Cappuccio F. P., Cooper D., D’Elia L., Strazzullo P. & Miller M. A. Sleep duration predicts cardiovascular outcomes: a systematic review and meta-analysis of prospective studies. Eur. Heart J. 32, 1484–1492 (2011). - PubMed
Publication types
Grants and funding
LinkOut - more resources
Full Text Sources
