. 2025 Jan 30;6(4):100831.
doi: 10.1016/j.xinn.2025.100831. eCollection 2025 Apr 7.

Novel cancer stem cell-targeted retinoid ZSH-512 impedes colorectal cancer progress via KDM3A-mediated epigenetic reprogramming

Affiliations

Novel cancer stem cell-targeted retinoid ZSH-512 impedes colorectal cancer progress via KDM3A-mediated epigenetic reprogramming

Suyao Li et al. Innovation (Camb). .

Abstract

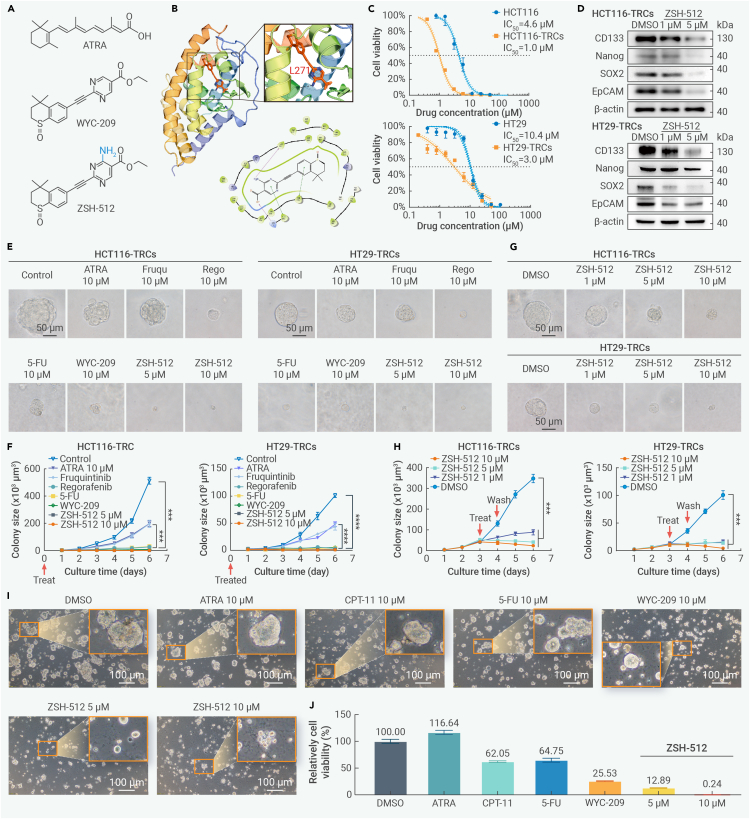
Advanced colorectal cancer (CRC) exhibits weak responses to multiple therapies, primarily due to the presence of cancer stem cells (CSCs), which drive high recurrence rates, metastasis, and drug resistance. We have previously systematically conducted CSC-targeted compound discovery and evaluation studies to inhibit CSC-mediated tumorigenesis and metastasis. Here, we identified ZSH-512, a novel synthetic retinoid that selectively targets retinoic acid receptor (RAR)γ, demonstrating its ability to effectively inhibit CRC-CSCs and patient-derived organoids (PDOs) in vitro and significantly reduce CSC-mediated tumor formation and liver metastasis in mouse models without noticeable toxicity. Mechanistically, integrated analysis of Assay for Transposase-Accessible Chromatin sequencing (ATAC-seq) and RNA sequencing (RNA-seq) revealed that ZSH-512 exerted its effect by modulating the RARγ-KDM3A axis to mediate epigenetic reprogramming and broadly suppress stemness-related signaling pathways, including Wnt, Hippo, and Hedgehog. ZSH-512 efficiently inhibited tumorigenesis in CRC-patient-derived tumor xenografts (PDXs) with high KDM3A expression, suggesting KDM3A as a potential predictive biomarker. Collectively, ZSH-512 is a promising therapeutic candidate for targeting CRC-CSCs with high efficacy.

Keywords: KDM3A; ZSH-512; cancer stem cell; colorectal cancer; epigenetic reprogramming; retinoid; tumor-repopulating cell.


Conflict of interest statement

The number of the patent registration related to this work is ZL202211618530.3.

Figures

None
Graphical abstract
Figure 1
Figure 1
ZSH-512 effectively inhibits CRC-CSCs growth in vitro (A) Structural diagram of ATRA, WYC-209, and ZSH-512. (B) Molecular-docking diagram of ZSH-512 with RARγ, illustrating the binding position of ZSH-512 with RARγ protein. (C) Sensitivity of CRC cells versus CRC-TRCs to ZSH-512. (D) Expression of featured stemness proteins in CRC-TRCs following ZSH-512 treatment for 24 h. (E and F) Representative bright-field images of CRC-TRCs (E) and statistical analysis of TRC sphere size (F) for HCT116 and HT29 TRCs treated with 10 μM ATRA, 10 μM fruquintinib (Fruqu), 10 μM regorafenib (Rego), 10 μM 5-fluorouracil (5-FU), 10 μM WYC-209, and 5 μM or 10 μM ZSH-512. Scale bar, 50 μm. (G and H) Representative bright-field images (G) and statistical analysis of the sizes (H) of CRC-TRCs treated with 1 μM, 5 μM, or 10 μM ZSH-512, observed for 3 days after treatment (ZSH-512 washed out after 24 h). (I) Representative bright-field images of CRC-PDO treated with 10 μM ATRA, 10 μM CPT-11, 10 μM 5-FU, 10 μM WYC-209, and 5 μM or 10 μM ZSH-512 for 48 h. Scale bar, 100 μm. (J) Statistical analysis of cell viability for PDO in (I). Values are presented as mean ± SEM; two-way ANOVA was applied in (F) and (H). ∗∗∗p < 0.001.
Figure 2
Figure 2
ZSH-512 inhibits CRC-TRC proliferation in vivo (A) Schematic diagram of in vivo efficacy studies utilizing BALB/c nude mice. Mice were subcutaneously implanted with HCT116-TRCs and randomized into four groups at day 7, following by DMSO (0.1%, intraperitoneal [i.p.]), 5-FU (25 mg/kg, i.p.), WYC-209 (5 mg/kg, i.p.), or ZSH-512 (5 mg/kg, i.p.) treatment. (B) Demonstration of subcutaneous tumors acquired from necropsy at the endpoint. (C) Tumor volumes of this study in response to control, 5-FU, WYC-209, or ZSH-512 treatment. (D and E) Statistical diagram showing the quantification of tumor volume and tumor weight at the endpoint with the indicated treatments (n = 6). Values are presented as mean ± SEM; one-way ANOVA. (F and G) Representative images and histopathological analysis of CD133 and Ki67 IHC staining in formalin-fixed subcutaneous tumor tissues (scale bar, 100 μm). Values are presented as mean ± SEM; two-way ANOVA. (H) Statistical diagram showing quantification of mouse body weight at the endpoint of indicated treatment (n = 6). Values are presented as mean ± SEM; one-way ANOVA. (I) Representative images of H&E staining in formalin-embedded heart, liver, lung, kidney, spleen tissues (scale bar, 200 μm). ns, not significant; ∗p < 0.05, ∗∗∗p < 0.001.
Figure 3
Figure 3
ZSH-512 inhibits CRC-TRC liver metastasis in vivo (A) Schematic diagram of a spleen-injected liver-metastatic model. (B) Drug administration workflow. The MC38-TRC-implanted liver-metastatic model was established in C57/BL6 mice, which were then treated with DMSO (0.1%, i.p.), 5-FU (25 mg/kg, i.p.), WYC-209 (0.23 mg/kg, i.p.) or ZSH-512 (2.3 mg/kg, i.p.). (C) Bioluminescence images of individual tumors at day 8 and day 20 after tumor implantation. (D) Images of livers acquired from necropsy at the endpoint. (E) Statistical diagram of liver weight at the endpoint. Values are presented as mean ± SEM; one-way ANOVA. (F) Statistical diagram of bioluminescent signal changes (day 20 endpoint compared with day 8 baseline) in MC38-TRC liver-metastatic model. Values are presented as mean +SEM; one-way ANOVA. ns, not significant; ∗p < 0.05, ∗∗p < 0.01.
Figure 4
Figure 4
ZSH-512 exerts its inhibitory function by regulating KDM3A expression (A) Venn diagram illustrating the overlapped genes among stemness genes, 512-3D specific genes, and 512-2D nonspecific genes from RNA-seq data. “Stemness” genes represent DEGs in HCT116-TRCs compared to HCT116 cells. The “512-3D specific” gene set included DEGs whose expression was altered in HCT116-TRCs following ZSH-512 treatment, while the “512-2D nonspecific” gene set included genes remained unchanged in HCT116 cells after ZSH-512 treatment. (B) ATAC-seq read-density heatmaps from HCT116-TRCs treated with DMSO or 5 μM ZSH-512 (n = 2 biological replicates). (C) Annotation of hyper-accessible and hypo-accessible regions within the promoters, transcription start sites (TSSs), transcription end sites (TESs), exons, introns, intergenic area, 3′ or 5′ UTR, and noncoding regions following ZSH-512 treatment. (D) GO enrichment analysis for hypo-accessible regions after ZSH-512 treatment. (E) Bubble plot of KEGG enrichment analysis for hypo-accessible regions after ZSH-512 treatment. (F) Intersected 13 genes of hypo-accessible genes from ATAC-seq and ZSH-512 stemness signature from RNA-seq data after ZSH-512 treatment. (G) Zoomed-in view of the KDM3A gene locus showing RNA-seq and ATAC-seq signals in HCT116, HCT116-TRCs, and HCT116-TRCs treated with ZSH-512 (5 μM), visualized using Integrated Genome Viewer (IGV) software.
Figure 5
Figure 5
KDM3A sustains tumoral characteristics of CRC-TRCs both in vitro and in vivo (A) Expression of the KDM3A in CRC-TRCs treated with DMSO (0.1%) or 1 μM or 5 μM ZSH-512. (B) Representative immunofluorescence images of KDM3A and DAPI staining in HCT116-TRCs treated with 0.1% DMSO or 1 μM or 5 μM ZSH-512 for 24 h. (C) Tumor growth comparison in xenograft models. Tumors derived from HCT116 cells transfected with control vector or two independent KDM3A knockdown constructs (shKDM3A #1 and shKDM3A #2) are shown. (D) Average tumor volume comparison among indicated groups in (C). Values are presented as mean ± SEM; two-way ANOVA. (E) Average tumor weight comparison among indicated groups in (C). Values are presented as mean ± SEM; one-way ANOVA. (F) Liver-metastatic model established using Kdm3a-knockdown or control vector MC38 in C57BL/6 mice. Bioluminescence imaging was performed on day 12 (n = 5 tumors per group). (G) Image of livers from mouse necropsy specimens at endpoint and representative images of H&E staining. (H) Relative mRNA expression of genes in Wnt, Hedgehog, and Hippo pathways after KDM3A knockdown. Values are presented as mean ± SEM; two-way ANOVA. (I) Representative image of spheroidal formation in CRC-TRCs after KDM3A knockdown and treatment with 0.1% DMSO (control) or 1 μM or 5 μM ZSH-512. Scale bar, 50 μm. Negative control (NC), cells transfected with scrambled short hairpin RNA (shRNA). (J) Statistical analysis of spheroid size. Values are presented as mean ± SEM; two-way ANOVA. ns, not significant; ∗p < 0.05, ∗∗p < 0.01, ∗∗∗p < 0.001.
Figure 6
Figure 6
KDM3A as a marker of poor clinical prognosis in CRC (A) Representative KDM3A IHC staining in tumor and adjacent normal tissues from the CRC patient in (B). Scale bars, 200 μm (top), 50 μm (bottom). (B) H-score for KDM3A in 371 pairs of surgical tissue samples from CRC patients; ΔKDM3A staining scores = (tumor − normal)/normal. Paired two-sided t test. (C–E) KDM3A expression levels in normal tissues, primary tumors, and liver metastases were analyzed across multiple public datasets for CRC, including TCGA-COAD, GSE14297, and GSE41258. (F–G) Kaplan-Meier survival analysis of overall survival in TCGA-COAD cohort (F) (n = 643) and Zhongshan CRC cohort (G) (n = 371) based on KDM3A expression levels. Log rank test. ∗∗∗p < 0.001.
Figure 7
Figure 7
ZSH-512 targets RARγ to regulate KDM3A transcription and modulate H3K9me2 levels of stemness-related genes (A) KDM3A and RARγ protein expression after RARγ knockdown in HCT116 and HT29 cells (β-actin as loading control). (B) Representative images of CRC-TRC spheroids (NC or shRARγ #1) treated with 0.1% DMSO or 1 or 5 μM ZSH-512. Scale bar, 50 μm. (C) Statistical analysis of CRC-TRC spheroid colony size. Values are presented as mean ± SEM; Two-way ANOVA. (D) ChIP-seq analysis of RARγ signals at the KDM3A locus in HCT116-TRCs treated with 5 μM ZSH-512 for 24 h. The promoter region is highlighted in red. (E) Dual-luciferase reporter assay evaluating RARγ-binding activity to the wild-type (WT) or mutant (MUT) KDM3A promoter.Values are presented as mean +SEM; One-way ANOVA. (F) Effects of ZSH-512 (1 μM and 5 μM) on H3K9me2 levels in HCT116-TRCs and HT29-TRCs. 0.1% DMSO was used as a control. H3 served as the loading control. (G) Knockdown of KDM3A (shKDM3A #1 and #2) increased H3K9me2 levels in HCT116 and HT29 cells. NC, negative control. H3 served as the loading control. (H) IGV tracks illustrating chromatin accessibility (ATAC-seq signal), H3K9me2 enrichment, and mRNA expression levels at the promoter regions of PROM1 and WNT3 following treatment with 5 μM ZSH-512 or 0.1% DMSO control. (I) ChIP-qPCR enrichment analysis targeting H3K9me2 at PROM1 or WNT3 promoter region or upstream(−)/downstream(+) 1 kb region after ZSH-512 treatment. n = 3 for each group; one-way ANOVA. ns, not significant; ∗p < 0.05, ∗∗p < 0.01, ∗∗∗p < 0.001.
Figure 8
Figure 8
ZSH-512 exhibits remarkable anti-tumor efficacy in CRC-PDX model with high KDM3A expression (A) H-score analysis of KDM3A expression in eight CRC-PDX models. (B) Representative KDM3A IHC staining of tumor tissues from PDX #2 and PDX #5. Scale bars, 500 μm (top left), 1000 μm (top right), 200 μm (bottom). (C) Schematic of drug administration in PDX models. Nude mice with tumor volumes of approximately 100 mm³ were intraperitoneally injected every 2 days for 12 days with control (0.1% DMSO), ATRA (25 mg/kg), 5-FU (25 mg/kg), low-dose ZSH-512 (0.23 mg/kg), or high-dose ZSH-512 (2.3 mg/kg) (n = 5 mice per group). (D–F) Necropsy images (D), tumor volume changes (E), and tumor weights (F) from the PDX model with high KDM3A expression. (G–I) Necropsy images (G), tumor volume changes (H), and tumor weights (I) from the PDX model with low KDM3A expression. Values are presented as mean ± SEM; two-way ANOVA for (E) and (H); one-way ANOVA for (F) and (I). ns, not significant; ∗p < 0.05.
None

Similar articles

References

    1. Visvader J.E., Lindeman G.J. Cancer stem cells: current status and evolving complexities. Cell Stem Cell. 2012;10:717–728. doi: 10.1016/j.stem.2012.05.007. - DOI - PubMed
    1. Liu J., Tan Y., Zhang H., et al. Soft fibrin gels promote selection and growth of tumorigenic cells. Nat. Mater. 2012;11:734–741. doi: 10.1038/nmat3361. - DOI - PMC - PubMed
    1. Magee J.A., Piskounova E., Morrison S.J. Cancer stem cells: impact, heterogeneity, and uncertainty. Cancer Cell. 2012;21:283–296. doi: 10.1016/j.ccr.2012.03.003. - DOI - PMC - PubMed
    1. Dean M., Fojo T., Bates S. Tumour stem cells and drug resistance. Nat. Rev. Cancer. 2005;5:275–284. doi: 10.1038/nrc1590. - DOI - PubMed
    1. Brown G. Antagonizing RARγ Drives Necroptosis of Cancer Stem Cells. Int. J. Mol. Sci. 2022;23 doi: 10.3390/ijms23094814. - DOI - PMC - PubMed

LinkOut - more resources