. 2025 May 21:16:1583892.
doi: 10.3389/fneur.2025.1583892. eCollection 2025.

Long-term outcomes in leucine-rich glioma inactivated-1 autoimmune encephalitis and associated biomarkers of inflammation and neuronal and glial injury

Affiliations

Long-term outcomes in leucine-rich glioma inactivated-1 autoimmune encephalitis and associated biomarkers of inflammation and neuronal and glial injury

Tyler L Borko et al. Front Neurol. .

Abstract

Introduction: Leucine-rich glioma inactivated 1 (LGI1) autoimmune encephalitis (AE) is characterized by seizures, as well as cognitive, memory, and behavioral disturbances. Blood-based biomarkers for inflammation and neuronal and glial injury have been evaluated as potential markers of disease severity and prognosis in AE.

Methods: Patients diagnosed with LGI1 AE, confirmed by cell-based assay, were enrolled and followed prospectively to gather plasma samples for biomarker testing. Biomarkers of neuronal and glial injury included plasma neurofilament light chain (NfL), glial fibrillary acidic protein (GFAP), ubiquitin c-terminal hydrolase L1 (UCHL-1), tau, and cytokine markers of inflammation. Biomarker data were logarithmically transformed and analyzed using longitudinal regression with the ratio of means between LGI1 AE and non-inflammatory controls. Clinical data were collected and correlated with blood-based biomarkers to assess their relationship to disease severity and long-term outcomes.

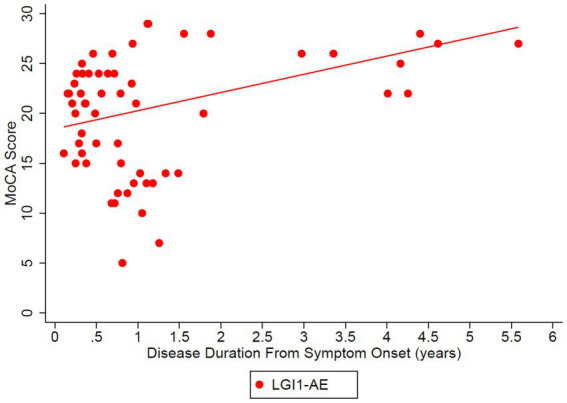
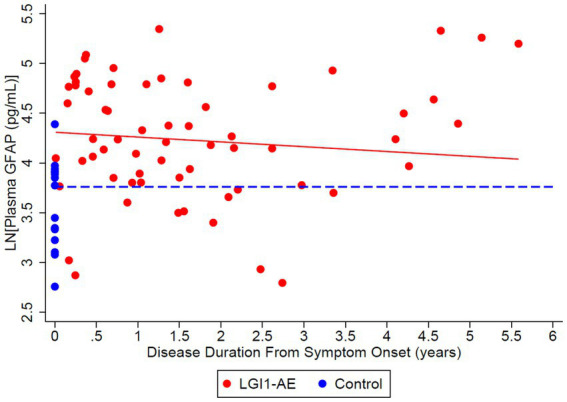
Results: Twenty-one LGI1 AE patients were enrolled from October 2018 to April 2024, and 16 migraine headache patients (56.3% male; average age: 58 years) served as non-inflammatory controls. One LGI1 AE patient in our cohort had a clinical relapse. Modified Rankin Score (mRS) and Montreal Cognitive Assessment (MoCA) improved over time. The mRS at symptom onset was 3.34 and dropped to 0.56 in a 5-year follow-up. Mean MoCA scores were 18.45 at the onset and increased to 29.40 in the 6-year follow-up. The model estimated geometric mean plasma NfL values at disease diagnosis to be 11.86 pg/mL; it was estimated to be 6.07 pg/mL when compared to non-inflammatory controls. The model also estimated the plasma GFAP values to be 77.70 pg/mL; it was estimated to be 36.26 pg/mL when compared to non-inflammatory controls. The trend of clinical improvement is paralleled with a slow decline in NfL and GFAP levels, returning to levels like our control population after 6 and 3 years, respectively. MoCA scores tended to recover more quickly in patients presenting with lower Nfl scores at symptom onset.

Conclusion: Improved clinical symptoms were correlated with improvements in initially high NfL and GFAP levels. In one patient with a clinical relapse, NfL and GFAP levels increased. NfL and GFAP may be useful biomarkers of disease progression in patients with LGI1 AE. However, additional studies are needed to better understand the effects of immunotherapy.

Keywords: autoimmune encephalitis; biomarkers; glial fibrillary acidic protein; leucine-rich glioma inactivated 1; neurofilament light chain.


Conflict of interest statement

The authors declare that the research was conducted in the absence of any commercial or financial relationships that could be construed as a potential conflict of interest. The author(s) declared that they were an editorial board member of Frontiers, at the time of submission. This had no impact on the peer review process and the final decision.

Figures

Figure 1
Figure 1
At the time of initial diagnosis, values for neurofilament light chain (NfL) and glial fibrillary acidic protein (GFAP) were 26.44 and 133.83 pg/mL, respectively, and decreased to 71.32 and 5.31 pg/mL, respectively, at 2 years post-diagnosis. Cytokine levels for IL-6 and IL-10 dropped from 1.68 and 2.18, respectively, to 0.95 and 0.51 at 6 months post-diagnosis. Similarly, neurological disability as measured by mRS, improved throughout this time course, with an initial mRS score of 4 at diagnosis, followed by improvement down to 1 after 2 years. The patient had a clinical relapse with return of faciobrachial dystonic seizures at 4 years post-diagnosis and 3 years after their last rituximab infusion. At the time of the relapse, steroids, rituximab, and lacosamide were restarted. At the time of the relapse, there was an increase in the mRS to 3, correlating to an increase in plasma NFL and GFAP.
Figure 2
Figure 2
The Modified Rankin Scale (mRS) was analyzed in the LGI1 AE cohort from the time of symptom onset longitudinally up to 6 years. A linear relationship was fit with longitudinal regression, slope estimate: −0.56 per year (95% CI: (−0.68, −0.43), p < 0.0001). Starting age was set to the mean of the first observation of mRS in LGI1 patients, at an age of 63.6 years.
Figure 3
Figure 3
Longitudinal Montreal Cognitive Assessment (MoCA) was analyzed in the LGI1 AE cohort from the time of symptoms. A linear relationship was fit with longitudinal regression, slope estimate: 1.83 per year (95% CI: (−0.40, 4.05), p = 0.1006). Starting age was set to the mean age of the first observation of MoCA in LGI1 patients, 64.4 years.
Figure 4
Figure 4
Initial NfL and GFAP levels at the onset of disease were used to analyze the estimated change in both MoCA and mRS to assess whether initial elevations in each biomarker impacted long-term outcomes in the MoCA score. Time-varying NfL and GFAP were tested for synchronous association with MoCA (closest match within 30 days). For matching NfL and GFAP to the MoCA data, there were 20 usable observations on 13 unique patients. Modeling was adjusted for age. Nfl (left) and GFAP (right) levels were broken down by quartiles using the lower quartile (blue), median (green), and upper quartile (red). A doubling of initial plasma NfL (left) was estimated to change expected MoCA at baseline by 1.4556 units (95% CI: (−2.8657, 5.7769), p = 0.4785), and to change the disease duration slope by −1.6760 units per year (95% CI: (−4.6996, 1.3476), p = 0.2611). A doubling of initial plasma GFAP (right) was estimated to change expected MoCA at baseline by 1.4981 units (95% CI: (−3.8240, 6.8201), p = 0.5516), and to change the disease duration slope by −0.7545 units per year (95% CI: (−3.2826, 1.7736), p = 0.5354). Plasma NfL in the lower quartile (blue) and median (green) trended toward a normal MoCA score of 30/30 at years 3 and 4, respectively. Patients with plasma NfL in the upper quartile (red) continued to have lower MoCA scores throughout the disease duration at 6 years. No similar trend was identified for GFAP.
Figure 5
Figure 5
Initial NfL and GFAP levels at the onset of disease were used to analyze the estimated change in both MoCA and mRS to assess whether initial elevations in each biomarker impacted long-term outcomes in the Modified Rankin Score (mRS). Time-varying NfL and GFAP were tested for synchronous association with mRS (closest match within 30 days). To match the NfL and GFAP to the mRS data, there were 30 usable observations on 19 unique patients. Modeling was adjusted for age. Nfl (left) and GFAP (right) levels were broken down by quartiles using the lower quartile (blue), median (green), and upper quartile (red). A doubling of initial plasma NfL was estimated to change expected mRS at baseline by 0.1217 units (95% CI: (−0.2756, 0.5191), p = 0.5334), and to change the disease duration slope by −0.05096 units per year (95% CI: (−0.1993, 0.09736), p = 0.4963). A doubling of plasma initial GFAP was estimated to change expected mRS at baseline by −0.1064 units (95% CI: (−0.6242, 0.4114), p = 0.6753), and to change the disease duration slope by −0.03034 units per year (95% CI: (−0.1698, 0.1091), p = 0.6663). Patients trended toward an mRS of ≤2 regardless of initial plasma NfL and GFAP levels.
Figure 6
Figure 6
Cytokines (A) IL-1β (p = 0.1215), (B) IL-6 (p = 0.1333), and (C) IL-10 (p = 0.0134) were elevated in LGI1 AE at the time of diagnosis when analyzed cross-sectionally using the first cytokine measurement compared to controls.
Figure 7
Figure 7
Cross-sectional analysis of 21 LGI1-AE and 16 control plasma samples showed an estimated geometric mean from regression plasma concentration of neurofilament light chain (NfL) of 11.13 pg/mL compared to non-inflammatory controls, 7.19 pg/mL. The ratio of geometric means of NfL in LGI1 AE vs. non-inflammatory controls was 1.55 (p = 0.0372) at symptom onset, and LGI1 AE approached non-inflammatory controls each year for 6 years. NfL decreased by 8.1% per year (p = 0.1404). Starting age was set to the mean of the first 4-Plex measurement at an age of 64.2 years.
Figure 8
Figure 8
Cross-sectional analysis of 21 LGI1-AE and 16 plasma samples showed a geometric mean plasma concentration of glial fibrillary acidic protein (GFAP) of 74.36 pg/mL compared to non-inflammatory controls, 43.00 pg/mL. The ratio of geometric means of GFAP in LGI1 AE vs. non-inflammatory controls was 1.73 (p = 0.0018) at the time of symptom onset and 1.50 (p = 0.0218) at 3 years following. GFAP decreased by 4.72% per year (p = 0.2553).

References

    1. Binks SNM, Klein CJ, Waters P, Pittock SJ, Irani SR. LGI1, CASPR2 and related antibodies: a molecular evolution of the phenotypes. J Neurol Neurosurg Psychiatry. (2018) 89:526–34. doi: 10.1136/jnnp-2017-315720, PMID: - DOI - PMC - PubMed
    1. van Sonderen A, Thijs RD, Coenders EC, Jiskoot LC, Sanchez E, de Bruijn MAAM, et al. . Anti-LGI1 encephalitis: clinical syndrome and long-term follow-up. Neurology. (2016) 87:1449–56. doi: 10.1212/WNL.0000000000003173, PMID: - DOI - PubMed
    1. Rodriguez A, Klein CJ, Sechi E, Alden E, Basso MR, Pudumjee S, et al. . LGI1 antibody encephalitis: acute treatment comparisons and outcome. J Neurol Neurosurg Psychiatry. (2022) 93:309–15. doi: 10.1136/jnnp-2021-327302, PMID: - DOI - PMC - PubMed
    1. Lee ST, Abboud H, Irani SR, Nakajima H, Piquet AL, Pittock SJ, et al. . Innovation and optimization in autoimmune encephalitis trials: the design and rationale for the phase 3, randomized study of satralizumab in patients with NMDAR-IgG-antibody-positive or LGI1-IgG-antibody-positive autoimmune encephalitis (CIELO). Front Neurol. (2024) 15:1437913. doi: 10.3389/fneur.2024.1437913, PMID: - DOI - PMC - PubMed
    1. Varhaug KN, Barro C, Bjornevik K, et al. . Neurofilament light chain predicts disease activity in relapsing-remitting MS. Neurol Neuroimmunol Neuroinflamm. (2018) 5:e422. doi: 10.1212/NXI.0000000000000422, PMID: - DOI - PMC - PubMed

LinkOut - more resources