. 2025 Sep;12(33):e00216.
doi: 10.1002/advs.202500216. Epub 2025 Jun 5.

Single-Cell and Spatial Transcriptomic Profiling of Penile Squamous Cell Carcinoma Reveals Dynamics of Tumor Differentiation and Immune Microenvironment

Affiliations

Single-Cell and Spatial Transcriptomic Profiling of Penile Squamous Cell Carcinoma Reveals Dynamics of Tumor Differentiation and Immune Microenvironment

Hongjian Song et al. Adv Sci (Weinh). 2025 Sep.

Abstract

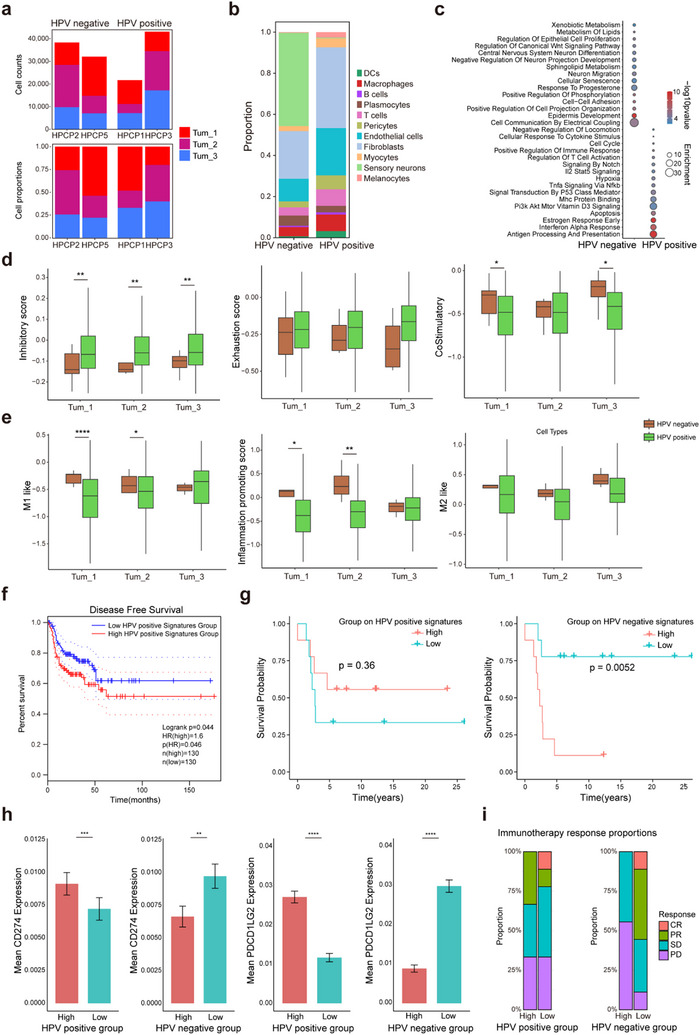
Penile squamous cell carcinoma (PSCC) is a highly aggressive malignancy without effective treatment due to limited knowledge of its development and tumor microenvironment (TME). In this study, single-nucleus RNA sequencing (snRNA-seq) and high-resolution spatial transcriptomics are employed to comprehensively investigate the development trajectories and the TME. The results revealed that PSCC cells mimicked the differentiation and tissue organization of normal penile epithelium, independent of the human papillomavirus (HPV) infection status. Notably, a spatial subtype, Tum_1, appeared at early stage of tumor differentiation and in tumor-normal boundary regions. This subtype exhibited enhanced basal-like and stemness features and showed high LAMC2 expression, which activated laminin-integrin signaling via ITGA6/ITGB4, promoting tumor invasiveness. Furthermore, the results indicated that HPV-positive basal stem-like neoplasms dampened the immune function of T cells and macrophages, promoting an immunosuppressive environment that facilitates tumor progression. Supporting this, the patients with head and neck squamous cell carcinoma and lung squamous cell carcinoma who have high expression of HPV-positive Tum_1 signatures derived greater benefit from PD-1 blockade therapy. In summary, the findings provide a comprehensive spatial landscape of the PSCC TME and suggest potential treatment approaches targeting laminin-integrin interaction and immunotherapy, especially in HPV-positive patients.

Keywords: penile squamous cell carcinoma; single‐nucleus RNA sequencing; spatial landscape; spatial transcriptomics; tumor microenvironment.


Conflict of interest statement

The authors declare no conflict of interest.

Figures

Figure 1
Figure 1
Comprehensive single‐cell and spatial transcriptomic atlas of penile cancer. a) Schematic overview of the integrated spatial omics design and workflow. The spatial transcriptomics (Stereo‐seq, four samples) and single‐nucleus RNA sequencing (snRNA‐seq, six samples) data were acquired from six patients (two patients with HPV infection and four patients without HPV infection). Integrative data analysis revealed the mechanism of penile cancer occurrence and progression, and immune microenvironment reshaping related to HPV infection status. (Created in BioRender. BioRender.com/e56j400). b) UMAP visualization of the snRNA‐seq dataset, where cells are color‐coded based on their respective cell subtypes. c) UMAP visualization showing the organization of snRNA‐seq data by HPV infection status (left) and individual patient identity (right). On the left, cells are grouped and color‐coded to distinguish HPV‐positive and HPV‐negative cases, revealing transcriptomic differences driven by HPV infection status. On the right, cells are grouped by individual patients. d) Dot plot illustrating the expression patterns of key marker genes across identified cell types within the snRNA‐seq data. Each dot represents a gene's expression in a specific cell type, with the color intensity indicating the average expression level and the dot size reflecting the percentage of cells within that cell type expressing the gene. e) Spatial mapping of annotated single‐cell types onto spatial transcriptomic data derived from tissue sections of two HPV‐positive and two HPV‐negative patients. The spatial distribution of cell types is overlaid onto tissue sections, allowing the visualization of cell populations within their native spatial context. Adjacent pathological hematoxylin and eosin (H&E)‐stained images provide histological reference, with key tissue regions annotated and color‐coded: tumor regions outlined in red, normal epithelium regions in green, and stromal regions in yellow. This spatial mapping emphasizes the characteristic states of cell type distribution and the tumor microenvironment in penile cancer tissues.
Figure 2
Figure 2
Differentiation inference of normal epithelium and tumor cells. a) UMAP visualization of the tumor cells and normal epithelial cells in the snRNA‐seq dataset by employing unsupervised clustering, where cells are color‐coded based on their respective subtypes. b) Spatial distributions of normal epithelial cell subtypes and tumor cell subtypes for samples HPCP1, HPCP2, HPCP3, and HPCP5, determined by the Spoint deconvolution method. Samples that test positive for HPV are denoted with a “(+)”, while those that test negative for HPV are marked with a “(‐)”. The boxed areas were identified as tumor cell subtypes for further magnification on the right, depicting the spatial characteristics of tumor cell subtypes. White scale bar, 1 mm; Yellow scale bar, 200 µm. c) Heatmap with unsupervised clustering illustrating the expression patterns of marker genes across three distinct normal epithelial cell subtypes (subtypes 1, 2, and 3) as well as three tumor cell subtypes (subtypes 1, 2, and 3). d) The pseudo‐temporal trajectory among epithelial cell subtypes within the context of HPV infection status is illustrated, distinguishing between HPCP1 (HPV‐positive) and HPCP2 (HPV‐negative) samples. This visual representation employs a pseudo‐temporal path to trace the developmental progression of these cell subtypes. Arrows strategically positioned around the pseudo‐temporal path serve as guides, delineating the directionality of cellular evolution over time. e, f) Pseudo‐temporal branch analysis between the two trajectory paths to normal epithelial cells and tumor cells, respectively, for HPCP1 sample (e) and HPCP2 sample (f). On the left side of the visualization, gene names are annotated to identify the specific markers associated with each branch of the trajectory. The right side is dedicated to annotating enrichment pathways, which represent the biological processes along the pseudo‐temporal trajectory. g) The expression dynamics of key marker genes KRT10, KRT14, and KRT17 along the trajectory path of all samples. Zoomed‐out trajectory plot is labeled by epithelial cell subtypes.
Figure 3
Figure 3
Tumor cells retain epithelial‐like tissue differentiation structures. a) Dot plot showing gene expression profiles specific to tumor subtypes 1, 2, and 3. The color intensity indicates the average expression level of genes, while the dot size reflects the percentage of cells within that subtype expressing the gene. b) Spatial gene expression of ITGB4, LYPD3, and HEPHL1 in the Stereo‐seq data, highlighting potential tissue‐level organization features. c) Dot plot illustrating functional enrichment pathways of subtype‐specific genes for tumor subtypes 1, 2, and 3. The plot uses the ‐log10(p‐value) to signify the statistical significance of each pathway and enrichment score to quantify the extent of pathway enrichment. d) Stemness scores for tumor subtypes 1, 2, and 3 in snRNA‐seq data, statistically tested using the Wilcoxon test with Benjamini‐Hochberg correction. e) Violin plot validating epithelial feature scores against the distribution of normal epithelial cell subtypes identified in snRNA‐seq analysis. The analysis uses the Wilcoxon test with Benjamini‐Hochberg correction. BS: basal stem; BK: basal keratinocyte; DK: differentiated keratinocyte. f) Ternary plot comparing the phenotypic similarities and differences between tumor epithelium and normal epithelium. This plot provides a visual comparison of the phenotypic characteristics, highlighting both the shared and distinct features between the tumor and normal epithelium. g) Monocle2 analysis of the evolutionary trajectories of tumor‐ and normal‐epithelium‐specific BS gene expression patterns. The expressions of normal BS (above) and tumor BS (below) gene sets on the trajectory path of epithelial subtypes are shown for all samples. Zoomed‐out trajectory plot is labeled by epithelial cell subtypes. h) CytoTrace analysis depicting the differentiation order of tumor cell subtype clusters. Cumulative box plots showing the predicted differentiation ordering scores across tumor cell subtypes, statistically tested using the Wilcoxon test with Benjamini‐Hochberg correction. i) Survival analysis of high and low expression of Tum_1 signature genes in CESC and LSCC patients from the TCGA cohort. These survival curves show the prognostic value of Tum_1 subtype signature genes, statistically tested using the Mantel‐Cox log‐rank test. Statistical significance is indicated by ****p < 0.0001.
Figure 4
Figure 4
Two sources of Laminin‐332 promote the invasion of tumor basal stem‐like cells. a) Venn diagram illustrating the overlapping and distinct basal stem‐like cell signatures between tumor and normal epithelial tissues. The diagram highlights genes that are specific to tumor basal stem‐like cells, as well as the genes shared between tumor and normal basal stem‐like cells. Key representative genes for the intersection and tumor‐specific signatures are labeled. b) Quantitative expression patterns of Laminin‐332 subunit LAMC2 and its receptors (ITGA6/ITGB4) in spatial transcriptomics. Red ellipses on the spatial transcriptomics images emphasize the corresponding regions in the pathological tissue sections of normal epithelium. c) Violin plot validating the expression levels of Laminin‐332 subunits and the integrin families among the tumor cell subtypes. d) SCENIC transcription factor analysis across different cell layers in tumor and normal epithelial tissues. This analysis identifies key transcription factors that regulate gene expression in cell subtypes within the tumor and normal epithelium. e, f) Cell proliferation in Penl1 cells was evaluated after HMGA2 and LAMC2 knockdown (siHMGA2 and siLAMC2) or overexpression (oeHMGA2 and oeLAMC2) via small interfering RNA and plasmid transfection, respectively, for 48 and 72 h, statistically tested using the two‐tailed unpaired Student's t‐test. g, h) Transwell invasion assay was performed in Penl1 cells following HMGA2 and LAMC2 knockdown (siHMGA2 and siLAMC2) or overexpression (oeHMGA2 and oeLAMC2) via small interfering RNA and plasmid transfection for 48 h, statistically tested using the two‐tailed unpaired Student's t‐test. i) Ligand‐receptor interactions between tumor basal stem‐like cells and stromal cells. This analysis explores the molecular interactions involved in the communication between Tum_1 cells and the surrounding stromal cells. j) Bulk expression differences of LAMC2 and Laminin‐332 subunit encoding genes in cervical, esophageal, and head/neck squamous cancers compared to normal tissues. Comparisons include data from TCGA normal samples and GTEx, illustrating the upregulation of these genes in various cancer types, statistically tested using the two‐sample t‐test. k, l) Survival analysis of high and low expression of LAMC2 (k) and Laminin‐332 (l) subunit encoding genes in head/neck squamous cancer. These survival curves show the prognostic value of LAMC2 and Laminin‐332 subunit encoding genes, statistically tested using the Mantel‐Cox log‐rank test. Statistical significance is indicated by ***p < 0.001, **p < 0.01, *p < 0.05.
Figure 5
Figure 5
Immune landscape around tumor cells and cell communication regulation. a) Heatmap showing cell type proportions of being neighbors within the 30 um radius surrounding tumor cell subtypes 1, 2, and 3. b) Umap visualizations of immune cell subtypes, labeled by cell subtype and HPV infection status, respectively. c) Cell‐cell interaction strength between different cell types within the region of the 100‐um radius around Tum_1. The width of the line is represented as the interaction strength. d) Heatmap showing immune cell subtype proportions of being neighbors within the 30 um radius surrounding tumor cell subtypes 1, 2, and 3. e) Heatmap showing the differences in numbers of cell‐cell interactions when comparing the region of the 200 um radius around Tum_1 to the region of the 100 um radius around Tum_1. f) Stacked bar plot showing the immune cell subtype proportions of being neighbors within different radius distances surrounding Tum_1. g) The proportions of APOE+ macrophage and SDC1+ plasma cell of being neighbors within different radius distances surrounding Tum_1. h) Spatial distributions of immune cell subtypes, determined by the Spoint deconvolution method. Adjacent pathological HE‐stained images highlight key tissue regions, with tumor regions outlined in red and stromal regions in yellow. i, j) Immunofluorescence staining of poorly differentiated (i) and well‐differentiated (j) penile squamous cell carcinoma using antibodies against panCK (green), CD4 (yellow), CD8 (red), CD68 (purple), and CD20 (white). Nuclei were counterstained with DAPI (blue). Images were captured using laser confocal microscopy to illustrate the infiltration of immune cells in penile squamous cell carcinoma with varying degrees of differentiation. Scale bars: 50 µm. k) Cell‐cell communication analysis between tumor cells as sender cells and immune cell subtypes as receiver cells. The left panel shows a dot plot illustrating the expression patterns of ligands in tumor cells. The heatmap analyzes the regulatory potential of prioritized ligands from tumor cells and predicted target genes in immune cell subtypes. The bottom panel shows a dot plot analyzing the expression levels of target genes in immune cell subtypes.
Figure 6
Figure 6
HPV infection regulates tumor immune microenvironment, affects prognosis, and immunotherapy efficacy. a) Stacked bar plot showing the Tum_1, Tum_2, Tum_3 subtype proportion and number in Stereo‐seq data, separated by HPV‐positive samples and HPV‐negative samples. b) Stacked bar plot representing the distribution of various cell types within HPV‐positive and HPV‐negative samples as derived from snRNA‐seq data. c) Dot plot illustrating the comparative analysis of enriched pathways between HPV‐positive and HPV‐negative tumors from snRNA‐seq data. The plot uses the ‐log10(p‐value) to signify the statistical significance of each pathway and enrichment score to quantify the extent of pathway enrichment. d) Box plots representing functional gene set scores of T cells within 30 um radius surrounding tumor subtype 1, 2, and 3 in the Stereo‐seq data, separated by HPV‐positive samples and HPV‐negative samples, statistically tested using the two‐sample t‐test. e) Box plots representing functional gene set scores of macrophages within 30 um radius surrounding tumor subtypes 1, 2, and 3 in the Stereo‐seq data, separated by HPV‐positive samples and HPV‐negative samples, statistically tested using the two‐sample t‐test. f) Disease‐free survival analysis assessing disease‐free intervals, contrasting groups characterized by high and low expression levels of specific marker gene set associated with HPV‐positive Tum_1, statistically tested using the Mantel‐Cox log‐rank test. g) Kaplan‐Meier survival curves delineate the disparities of survival probabilities in GSE93157 cohorts which received anti‐PD‐1 immunotherapy, separated by elevated and reduced expression of marker gene panel specific to HPV‐positive Tum_1 and, in parallel, HPV‐negative Tum_1, statistically tested using the Mantel‐Cox log‐rank test. h) Box plots showing gene expression levels of CD274 and PDCD1LG2 across different groups, specifically those with high and low expression of the marker gene set for HPV‐positive Tum_1 and HPV‐negative Tum_1. i) Stacked bar plot showing the outcomes of anti‐PD‐1 immunotherapy in patients with high and low expression of the marker gene set of HPV‐positive Tum_1 and HPV‐negative Tum_1, respectively. CR: complete response; PR: partial response; SD: stable disease; PD: progressive disease. Statistical significance is indicated by *p < 0.05, **p < 0.01, ***p < 0.001, ****p < 0.0001.

References

    1. Thomas A., Necchi A., Muneer A., Tobias‐Machado M., Tran A. T. H., Van Rompuy A. S., Spiess P. E., Albersen M., Nat. Rev. Dis. Primers 2021, 7, 11. - PubMed
    1. Bray F., Laversanne M., Sung H., Ferlay J., Siegel R. L., Soerjomataram I., Jemal A., CA Cancer J. Clin. 2024, 74, 229. - PubMed
    1. Brouwer O. R., Rumble R. B., Ayres B., Sanchez Martinez D. F., Oliveira P., Spiess P. E., Johnstone P. A. S., Crook J., Pettaway C. A., Tagawa S. T., JCO Oncol. Pract. 2024, 20, 33. - PubMed
    1. Elst L., Vreeburg M., Brouwer O., Albersen M., Eur. Urol. Focus 2023, 9, 241. - PubMed
    1. Brouwer O. R., Albersen M., Parnham A., Protzel C., Pettaway C. A., Ayres B., Antunes‐Lopes T., Barreto L., Campi R., Crook J., Fernandez‐Pello S., Greco I., van der Heijden M. S., Johnstone P. A. S., Kailavasan M., Manzie K., Marcus J. D., Necchi A., Oliveira P., Osborne J., Pagliaro L. C., Garcia‐Perdomo H. A., Rumble R. B., Sachdeva A., Sakalis V. I., Zapala L., Sanchez Martinez D. F., Spiess P. E., Tagawa S. T., Eur. Urol. 2023, 83, 548. - PubMed

MeSH terms

LinkOut - more resources