. 2025 Aug 4;224(8):e202408026.
doi: 10.1083/jcb.202408026. Epub 2025 Jun 5.

Taperin bundles F-actin at stereocilia pivot points enabling optimal lifelong mechanosensitivity

Affiliations

Taperin bundles F-actin at stereocilia pivot points enabling optimal lifelong mechanosensitivity

Inna A Belyantseva et al. J Cell Biol. .

Abstract

Stereocilia are rod-like mechanosensory projections consisting of unidirectionally oriented actin filaments that extend into the inner ear hair cell cytoskeleton, forming dense rootlets. Taperin (TPRN) localizes to the narrowed-down base of stereocilia, where they pivot in response to sound and gravity. We show that TPRN-deficient mice have progressive deafness characterized by gradual asynchronous retraction and fusion of outer and inner hair cell stereocilia, followed by synaptic abnormalities. Stereocilia that lack TPRN develop warped rootlets with gradual loss of TRIOBP-5 and ANKRD24 from mechanosensory rows starting postnatally. In contrast, TPRN overexpression causes excessive F-actin bundling, extra rows, and over-elongation of stereocilia during development. Purified full-length mouse TPRN cross-links F-actin into bendable bundles reflecting in vivo data. This F-actin-bundling ability is attributed to the TPRN N-terminal region. TPRN interacts with the membrane receptor PTPRQ, connecting the F-actin core to the plasma membrane, stabilizing stereocilia. Thus, TPRN is a specialized F-actin bundler strategically located to augment stereocilia rootlet formation and their pivot point flexibility for sustained sound-induced deflections.


Conflict of interest statement

Disclosures: The authors declare no competing interests exist.

Figures

Figure 1.
Figure 1.
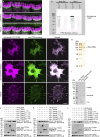
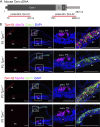
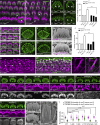
TPRN protein domains, motifs, antibody epitopes, and localization in mouse cochlear hair cells. (A) Illustration of a mechanosensory stereocilia bundle on the apical surface of a hair cell. The three rows of actin-based stereocilia are interconnected by tip links and anchored to the hair cell body by F-actin rootlets (magenta). The tapered region of stereocilia is indicated by a bracket and outlined by green lines. (B) Schematic of mouse TPRN protein encoded by four exons indicated by different colors and number of aa encoded by each exon. Below the TPRN schematic, colored bars indicate predicted domains using ELM (http://elm.eu.org) unless otherwise indicated. The gray bars indicate two small regions of aa sequence percentage identity to phostensin (aa 15–107 and 590–646). Purple bar is an EH ligand (aa 61–65) containing an NPF motif, the light green bars show three Y-based endocytic sorting motifs (Yxxphi) (aa 85–88, 593–596, and 605–608), blue bar is a NLS (aa 617–627, https://nls-mapper.iab.keio.ac.jp), light blue bar is a PP1-binding site with KISF motif (aa 624–627), violet bar is a nuclear export signal, NES (aa 598–609), and an arrow indicates a PDZ ligand (aa 744–749). Locations of epitopes of custom rabbit polyclonal anti-TPRN antibodies (red bars above the schematic) PB913 and PB939 and a RabmAb against the same epitope to raise antiserum PB939. The brown bar—location of epitope of the commercial anti-TPRN (C9ORF75) antibody (HPA020899, RRID:AB_1845835; MilliporeSigma). (C) Confocal microscopy image showing TPRN localization (green) at bases of stereocilia spanning the taper region of all rows. (D) Stereocilia side view image. Unless otherwise stated, rhodamine-phalloidin (magenta) was used to counterstain F-actin in most panels. (E) Localization of TPRN (green) in relation to ANKRD24 (blue) in P20 WT OHC stereocilia. (F) Localization of ANKRD24 (blue) in relation to its interacting partner TRIOBP-5 (yellow) in P14 WT IHCs. (E′–F′) Line graphs of normalized fluorescence intensity for each protein measured from the stereocilia pivot point (0) to 1-μm down (1) and 1-μm up (−1) the stereocilium. ANKRD24 (cyan) concentrates at the pivot point of every stereocilium (magenta). A fainter signal of ANKRD24 (F′) distributes along the rootlet portion highlighted by TRIOBP-5 in (F). (G–J) STED super-resolution images at the pivot points of OHC stereocilia in P18 C57BL/6J mouse revealed rootlet insertions into cuticular plate stained with Star Red phalloidin (G) and surrounding ring patterns of TRIOBP-4 (H), TRIOBP-5 (I), and ANKRD24 (J). Inserts in H–J show mean intensity projection of aligned cross sections through the pivot point of row 1 OHC stereocilia double stained with F-actin (phalloidin, magenta) and TRIOBP-4 (n = 25), TRIOBP-5 (n = 52), and ANKRD24 (n = 64), correspondingly (turquoise). (K) A similar ring pattern at P6 stereocilia taper region just above the apical surface of IHC is revealed in STED image by a secondary nanobody together with anti-TPRN antibody (green). (L) Image along the longitudinal axis of P6 IHC stereocilia showing a funnel-like pattern (white arrowheads) of TPRN staining (green) at the taper region. (M) STED image of P6 OHC showing similar TPRN ring pattern (green). (N) Enlarged images of a rectangular area depicted in M of individual OHC stereocilia outlined by TPRN rings (green). (O) Diameters of ring staining for ANKRD24, TRIOBP-4, and TRIOBP-5 in the longest row (Row 1) stereocilia of OHCs. Number of stereocilia/cells: ANKRD24, n = 39/3; TRIOBP-5, n = 57/3; TRIOBP-4, n = 54/4. Asterisks show statistical significance of the differences between proteins: overall one-way ANOVA (P < 0.0001) followed by Tukey’s post hoc comparison test (***P < 0.0001). The graph compares the average ring diameters for each protein using one-way ANOVA (P < 0.0001) followed by Tukey’s post hoc comparison test (***P < 0.0001). (P) Examples of intensity profiles along a line through the center of a stereocilium rootlet cross section revealed by F-actin staining, which were used to determine the diameters of TRIOBP-4, TRIOBP-5, and ANKRD24 staining patterns in panel O. (Q) Similar plot of TPRN fluorescence intensity also confirms the ring appearance of TPRN staining in P6 stereocilia cross sections. (R) Left, mean intensity projection of 20 aligned longitudinal sections through the base of row 1 IHC stereocilia stained with F-actin (magenta) and TPRN (green). Right, intensity profiles of F-actin and TPRN staining across stereocilium at different distances from the pivot point (0). Images in C-E and F were obtained using Zeiss LSM880 Airyscan confocal system and in G–J using a FACILITY microscope system (Abberior Inc). Inserts in H-J and images in K-N and R were obtained using a STEDYCON super-resolution system (Abberior Inc) on an Eclipse Ti2 microscope (Nikon). Scale bars are 2 μm in C–J, 1 μm in K–N, 500 nm in L and R, and 200 nm in H–J inserts. Scale bar in G applies to G–J.
Figure S1.
Figure S1.
Validation of anti-TPRN antibodies used in the study. TRX-TPRN purity and instability without TRX tag and additional examples of Co-IP of TPRN and actin. (A) Custom-made rabbit polyclonal PB913 antibody against a peptide corresponding to aa residues 516–535 encoded by exon 1 of mouse Tprn shows localization of TPRN (green) at the base of hair cell stereocilia of adult mouse IHCs. (B) A commercial anti-C9ORF75 (TPRN) antibody (HPA020899, RRID:AB_1845835, aa 446–517, MilliporeSigma), shows localization of TPRN (green) similar to the custom-made PB913 antibody. (C) Custom-made C-terminal rabbit polyclonal antibody PB939 against a peptide corresponding to aa 726–749 of mouse TPRN also recognizes TPRN (green) at the base of stereocilia like the antibodies described above. Stereocilia bundles were visualized by counterstaining using rhodamine-phalloidin (shown in magenta). (D) Western blot from mouse brain and cochlear tissues using custom TPRN RabmAb against a C-terminal peptide identical to the antigen for PB939 antibody shows a specific band in Tprn+/+ tissues, but not in Tprn−/− tissues, indicating that the antibody specifically recognizes TPRN. (E–G) COS-7 cells transfected with mCherry-MYO10-TPRN construct are stained with three antibodies against TPRN, PB913 (E), anti-C9ORF75 (F), and PB939 (G). TPRN fused to mCherry-MYO10-HMM (magenta) was transported to the filopodia tips at the cell periphery and recognized there by anti-TPRN antibodies (green) used to immunostaining transfected cells. Co-localization of mCherry-MYO10-TPRN (magenta) with TPRN antibody immunoreactivity (green) results in white color, confirming that these three anti-TPRN antibodies can specifically recognize TPRN in different cellular compartments, including filopodia. Scale bar in A–C is 5 μm, in E–G is 20 μm. (H) Silver-stained acrylamide gel of purified TRX-TPRN shows a major band at about 100 kDa. (I) Coomassie blue–stained gel showing TRX-TPRN treated with thrombin protease to remove the TRX-tag. Lane 1—untreated purified TRX-TPRN, lane 2—TRX-TPRN treated with thrombin, and lane 3—thrombin alone. Note, there is no band of TPRN without TRX (∼80 kDa) present in the second lane, but both thrombin-specific band and the TRX band are present, indicating that the removal of the TRX tag resulted in an unstable TPRN protein. (J–L) Additional examples of Myc-TPRN and HA–β-actin Co-IP shown in Fig. 4 C. Note the variable amount of HA–β-actin in the Co-IP row for each experiment. Source data are available for this figure: SourceData FS1.
Figure 2.
Figure 2.
Exogenous EGFP-TPRN results in F-actin abnormalities in WT IHCs and in COS-7 cells. (A and B) Similar to endogenous TPRN, transfected FL mouse EGFP-TPRN (green) is localized to stereocilia bases of P2–P4 hair cells (n = 2 cells, upward pointing arrows). (C and G–J) However, excessive expression of EGFP-TPRN transfected into hair cells leads to mislocalization of EGFP-TPRN at stereocilia tips (n = 9 cells) causing abnormal actin remodeling, over-elongation (n = 12 cells), thickening (n = 10 cells), and degeneration of stereocilia (n = 14 cells) (arrowheads in B, C, and G–J). (D–F) Thin abnormally long filamentous structures extend from tips of P4 OHC stereocilia (B, down-pointing arrow), and abnormally long, curvy filaments emanate from the tips of stereocilia of some transfected P3 vestibular hair cells (n = 5 cells) (D–F). (E) Confocal channel showing EGFP-TPRN alone. (F) Phalloidin-stained F-actin. The curled filaments contained EGFP-TPRN stained by phalloidin, indicating abnormal actin remodeling at stereocilia tips. (G–J) Mislocalization of EGFP-TPRN to stereocilia tips in P3 IHC and OHCs (n = 8 cells) (I and J, arrowheads), hair bundle degeneration (n = 14 cells) (G–J), and abnormal actin bundling in hair cell cytoplasm (n = 6 cells) (H, arrows), as well as dotted pattern of EGFP-TPRN in nuclei of hair cells (n = 7 cells) (G, I, and J, arrows) when FL TPRN is overexpressed. (K) Similar patterns of EGFP-TPRN expression showing abnormal actin bundles in the cytoplasm (arrowhead) and dotted pattern in nuclei of transfected COS-7 cells (arrows). Note, the dots of TPRN in the nucleus are smaller when TPRN expression is low and become prominent with higher expression levels of EGFP-TPRN. (L) Three COS-7 cells show different stages of EGFP-TPRN expression (1, 2 and 3): initially dots of TPRN are observed in nuclei (arrow 1). TPRN dots then become short filaments (arrow 2), which coalesce into a long and thick whorl-like bundles (arrow 3), as also shown in Video 1. (M) Overexpressed TPRN260–749 (green) localizes to nuclei (blue DAPI staining, arrows) of COS-7 cells (magenta, phalloidin). Right panel shows TPRN260–749 (green) channel only. (N) FL TPRN (green) co-localizes with F-actin in the cytoplasm of COS-7 cells when NLS of Tprn-GFP cDNA is mutated by replacing Lys(K) at positions 621, 622, and 624 to Ala(A), so the protein sequence was changed from “GSSRKKMKISF” to “GSSRAAMAISF”. (O) In P3 IHCs, EGFP-TPRN1–260 localizes along the stereocilia length and over-elongates stereocilia (n = 3 cells). (P) No nuclear staining is observed (arrow) since TPRN1–260 lacks NLS motif. (Q and R) Overexpression of a truncated EGFP-TPRN1–260 in non-sensory cells of P3 OC explant causes elongation and thickening of apical microvilli (Q), and in the internal sulcus cell area induces additional bundles of microvilli (n = 3 cells) reminiscent of stereocilia bundles of nascent vestibular hair cell (R), which appear limp and lacking the staircase architecture of WT stereocilia bundles. (S and T) Overexpression of a C-terminal fragment EGFP-TPRN730–749 does not alter WT stereocilia bundle morphology and was uniformly distributed along the entire length of P4 stereocilia, the kinocilium (arrow), and cell body (n = 5 cells) of vestibular hair cells (S) and P3 auditory hair cells (T) similar to expression of control EGFP alone in hair cells. In all panels phalloidin (magenta) was used to visualize F-actin. Scale bars are 5 μm.
Figure 3.
Figure 3.
TPRN bundles F-actin filaments in vitro. (A) Coomassie blue-stained SDS-PAGE gel showing purified TPRN after expression in E. coli. A TRX tag was added to the N terminus in-frame with mouse TPRN, which improves its solubility and stability. The first lane is the protein ladder. The second lane is the purified TRX-TPRN protein (arrow), the size of which is ∼100 kDa. (B–D) Actin filaments (green) in the presence of control TRX tag only (B) or TRX-TPRN (magenta) (C and D). Actin (3 μM) was incubated with 0.1 μM TRX or TRX-TPRN at RT for 1.5 h. Using an antibody against TRX, the localization of TRX-TPRN (magenta) along F-actin filamentous structures (green) was visualized by fluorescence microscopy. Note, TRX tag alone (magenta) did not bind to F-actin filaments as shown in B. (D) TRX-TPRN (magenta) was distributed along the length of F-actin filamentous structures (green) and not concentrated just at the ends of F-actin. Scale bars in B–D: 5 μm. (E) Negative stain TEM images of F-actin polymerized with 100 nM TRX, 100 nM TRX-TPRN, 300 nM TRX-TPRN, 300 nM ESPN, or 1 µM ESPN. Images acquired at a low magnification (upper panels) and high magnification (lower panels). The short green lines across the bundles show the examples of bundle diameter measurements. ESPN is used at 300 nM or above since only a few bundles appear at 100 nM. TRX-TPRN bundles show bending (black arrows), while ESPN bundles occasionally appear kinked (black arrowheads). TRX-TPRN and ESPN bundle actin filaments (red arrows) with bifurcations (open arrows). Filaments bundled by 100 nM TRX-TPRN show single filaments branched from bundles (open red arrowheads). TRX samples occasionally show filaments neighboring one another (red arrowheads), which are analyzed as pseudo-bundles in F and G. Scale bars: 200 nm (E, upper panels) and 50 nm (E, lower panels). (F) Average diameter of F-actin bundles. Compared with the diameter of control 100 nM TRX (0.022 ± 0.005 µm, average ± SD, n = 46), the bundle diameter is significantly larger for 100 nM TRX-TPRN (0.035 ± 0.018, n = 102), 300 nM TRX-TPRN (0.041 ± 0.013 µm, n = 138), 300 nM ESPN (0.071 ± 0.034 µm, n = 87), and 1 µM ESPN (0.082 ± 0.035 µm, n = 73). One-way ANOVA shows P < 0.0001. Post hoc multiple comparisons by Tukey (****P < 0.0001; ***P = 0.0001; *P < 0.05; n.s.: P ≥ 0.05). (G) Average distances between filaments increasing in the order of TRX, TRX-TPRN, and ESPN. The concentration of TRX-TPRN and ESPN does not affect the distances between filaments. One-way ANOVA shows P < 0.0001 (8.7 ± 1.9 nm, n = 52 for 100 nM TRX; 9.5 ± 2.0 nm, n = 122 for 100 nM TRX-TPRN; 8.8 ± 1.7 nm, n = 86 for 300 nM TRX-TPRN; 11.1 ± 2.4 nm, n = 134 for 300 nM ESPN; 11.5 ± 3.0 nm, n = 111 for 1 µM ESPN). Post hoc multiple comparisons by Tukey (****P < 0.0001; n.s.: P ≥ 0.05). (H) Actin-bundling by EGFP-TPRN in COS-7 cell nucleus. EGFP-TPRN (green), phalloidin (magenta), DAPI (blue). Note the forked/conjoined areas of actin bundles outlined by circles resemble the bifurcated bundles of purified TRX-TPRN in D and E. Scale bars, 10 μm. (I) A low-speed (13,500 × g) co-sedimentation assay was used to determine the cross-linking activity of TPRN. Actin (3 μM) was incubated alone or with 0.1 μM TRX-TPRN or 6 μM TRX protein or 3 μM α-actinin or 3 μM BSA under polymerization conditions, followed by centrifugation. Equivalent amounts of supernatant (S) and pellet (P) were separated using SDS-PAGE and stained with Coomassie blue. The experiments were repeated at least three times. (J) Quantification of the percentage of actin in the pellet is shown in G. Data are represented as mean ± SEM. ***P < 0.001 by unpaired two-sided t test (n = 4). (K) Coomassie blue–stained protein gel showing 3 μM actin co-sedimented with TPRN of increased concentrations (13–100 nM). Immunoblotting detected TPRN in supernatant and pellet. (L) Percentage of actin in pellet is shown in I (n = 3). 100 nM TRX-TPRN was sufficient to saturate the binding sites of 3 μM F-actin. Data are represented as mean ± SEM. TPRN in I–L is tagged with TRX at its N terminus as indicated in A. Source data are available for this figure: SourceData F3.
Figure 4.
Figure 4.
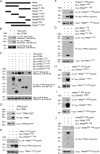
TPRN interaction with actin and oligomerization. (A) Diagram of the TPRN constructs used for biochemical experiments. (B and C) TPRN interacts with β-actin. HEK293 cells were transfected with the constructs indicated for each panel. Immunoprecipitations were carried out with Myc antibody, followed by western blotting to detect co-expressed proteins. The upper rows show Co-IP results, and the lower rows show input protein. IP: Myc shows IP of all the constructs with Myc tag. (B) HA–β-actin is pulled down by FL Myc–TPRN, indicating its interaction with TPRN. No HA–β-actin was pulled down by Myc antibody without TPRN. (C) Each contiguous region of TPRN, (1–170, 171–410, 411–622, and 623–749 [RefSeq: NP_780495.2]) can mediate interactions with F-actin. Please see additional results in Fig. S1, J–L. (D) Co-IP shows homomeric interactions between FL TPRN–EGFP and Myc–TPRN. (E–J) Homomeric interactions of TPRN fragments illustrated by Co-IP. TPRN1–410-EGFP and Myc-TPRN1–410, TPRN411–749-EGFP and Myc-TPRN411–749, TPRN171–410-EGFP and Myc-TPRN171–410, TPRN411–622-EGFP and Myc-TPRN411–622, TPRN623–749-EGFP and Myc-TPRN623–749, and HA-TPRN1–170 and Myc-TPRN1–170 can oligomerize. Molecular weight markers (kDa) are shown on the left side of each blot. Source data are available for this figure: SourceData F4.
Figure 5.
Figure 5.
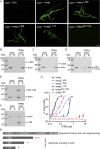
Characterization of actin-bundling ability of TPRN. All TPRN fragments and FL TPRN have a TRX tag at the N-terminus. (A) Actin filaments in the presence of a TRX tag, FL TPRN, or fragments of TPRN. Actin (3 μM) was incubated with 3 μM TRX, 0.1 μM FL TPRN, 0.15 μM TPRN1–400, 0.5 μM TPRN1–300, 0.75 μM TPRN1–170, or 1.5 μM TPRN301–749 at RT for 1.5 h, followed by labeling with fluorescent FITC-phalloidin. The experiment was performed more than three times, yielding consistent results. Scale bars: 5 μm. (B–F) Low-speed co-sedimentation assays were used to determine the cross-linking activity of TPRN fragments. Actin (3 μM) was incubated with buffer or 0.2 μM TPRN1–400 (B), 0.5 μM TPRN1–300 (C), 0.75 μM TPRN1–170 (D), 3 μM TPRN301–749 (E), or 9 μM TPRN1–63 (F) at RT for 1.5 h, followed by centrifugation. Equivalent amounts of supernatant (S) and pellet (P) were separated using SDS-PAGE and stained with Coomassie blue. Arrows with numbers on the right-hand side of each gel indicate corresponding TPRN fragment length in aa used in each experiment. All experiments were repeated at least three times. (G) Actin was incubated with varying amounts of FL TPRN or fragments of TPRN. Then, low-speed co-sedimentation assays were performed. The percentage of actin in the pellet was quantified (n ≥ 3). Data are represented as the mean ± SEM. (H) The TRX-TPRN schematics illustrating actin-bundling activities of various TPRN fragments indicated by a bracket based on co-sedimentation data showing that bundling relies on the N-terminal part of TPRN, while all TPRN fragments can bind actin and oligomerize. Source data are available for this figure: SourceData F5.
Figure S2.
Figure S2.
Tprn mRNA expression in WT and Tprn −/− mouse organ of Corti (OC) and stria vascularis (SV) using RNAscope probes. (A) Regions of Tprn cDNA sequence of two RNAscope probes used to detect mouse Tprn mRNA. Probe-Mm-Tprn-01 targets the sequence toward the N-terminus of Tprn mRNA. Probe-Mm-Tprn-02 targets sequence for the C-terminus of Tprn mRNA. (B) Expression of Tprn mRNA in hair cells of the OC and SV at P3 Tprn mutant mice (Tprn−/−) and P3 WT littermates (Tprn+/+) using Probe-Mm-Tprn-01 (red) and Probe-Mm-Tprn-02 (red). Hair cells were highlighted by Myo7a (Probe-Mm-Myo7a-C2, magenta). Three OHCs and one IHC are visible in sections and highlighted by Myo7a signal (magenta). Tprn mRNA signal (red) overlaps with Myo7a signal (magenta) in Tprn+/+ but absent in Tprn−/− OC. SV was highlighted by Cldn11 mRNA encoding tight junction claudin 11 (Probe-Mm-Cldn11-C3, green), a marker of SV basal cells. Tprn mRNA signal (red) overlaps with Cldn11 mRNA signal (green) and is also present in other SV cells in Tprn+/+ but not in Tprn−/− SV. Scale bars are 50 µm.
Figure 6.
Figure 6.
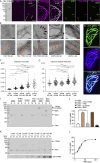
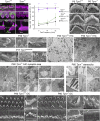
Tprn −/− mice are profoundly deaf at P60 and show abnormalities of IHCs and OHCs. (A–A″) Airyscan confocal images showing TPRN RabmAb immunoreactivity (green) and F-actin (magenta) in P20 WT (Tprn+/+) and TPRN null (Tprn−/−) mouse IHC (A) and OHC stereocilia (A′) and in P10 supporting cells surrounding IHCs and OHCs (A″). TPRN is localized at the base of Tprn+/+ stereocilia and associated with actin cytoskeleton of supporting Deiters’ cells but not detected in Tprn−/− hair cells and supporting cells. (A″) Enlarged side view of hair cell stereocilia showing TPRN localization at the base of OHC stereocilia in all three rows and co-localized with F-actin in ascending processes of Deiters’ cells. (B) Mean ABR thresholds at P60 of Tprn+/+, Tprn+/−, and Tprn−/− littermates at 8, 16, and 32 kHz. Using linear mixed effects regression, we found that Tprn−/− mice exhibited profound deafness at P60 at all frequencies (Tables S4 and S5), progressive deafness from P18 to P30 and P60 (Fig. S5 A; and Tables S2 and S3) and more pronounced early hearing loss at high frequencies (Fig. S5 A and Table S5). The graph displays mean ± SD. **, ***—significant difference in ABR threshold compared with Tprn+/+ animals at P < 0.01 and P < 0.001, respectively. Color of asterisks indicate the group showing the difference. (C–D″) Representative SEM images of IHC and OHC stereocilia bundles of P6 Tprn+/+ (C–C'') and P6 Tprn−/− mouse (D–D''). Note, a Tprn−/− IHC (D) has some stereocilia missing from the first row (arrow) and a less developed third row of stereocilia with more prominent pruning of thin stereocilia/microvilli as compared with a WT IHC stereocilia bundle (C). Tprn−/− OHC stereocilia bundle from apical turn (D′) also has a stereocilium missing from the first row and a shortened stereocilium in the second row (arrows), while all stereocilia in Tprn+/+ apical OHC (C′) are present and are of normal length. Tprn−/− OHC stereocilia bundle from the basal turn of the cochlea (D″) shows multiple missing stereocilia (arrows) from the third row and an altered V shape of the bundle, while the entire third row stereocilia are present in the WT V-shaped OHC from the basal turn (C″). (E and F) Stereocilia abnormalities in P30 Tprn−/− hair cells (E) are similar but less prominent than in P17 TprnN259/N259 hair cells (F). Shortening and disappearance of the third row stereocilia (E, left panel, forked arrow) and shortening of selective stereocilia from longer rows (E and F, left panels, arrows). Middle panels in E and F show OHCs with abnormal hair bundles. Right panels show fusion of IHC stereocilia (arrows). (G and H) TEM images of the synaptic area of a Tprn−/− IHC (H) show abnormal accumulation of endosome-like vesicular structures (arrow) when compared with a Tprn+/+ IHC (G). (I–Q) TEM micrographs of P60 Tprn−/− hair cells. (I) Accumulation of endosome-like vesicles in the cell cytoplasm (arrow) and presence of axosomatic efferent contacts with accumulation of vesicles at the postsynaptic sites (boxed area with an arrow). (J) Swollen and damaged IHC efferent presynaptic terminal. Boxed areas in I and J are enlarged in L–N, correspondingly. (K) Another example of swollen efferent terminal like in M. (O) IHC stereocilia show rootlet fragmentation and breakage at the stereocilia insertion point (top image), splayed rootlets within the cuticular plate, or multiple electron dense spots within stereocilia cores (bottom image). (P and Q) OHC stereocilia show long, prominent rootlets, sometimes penetrating abnormally deep into cytoplasm below the cuticular plate (P) and sometimes showing a hollow center of the rootlet structure (top image) and accumulation of the electron dense spots within the cell body nearby long splayed rootlets (bottom image) (Q). (R–Y) SEM images of P90 Tprn+/+ OC (R), showing three rows of OHC and one row of IHC from the middle turn of the cochlea with representative normal structure OHC hair bundle (S) and IHC hair bundle (T). (U) There are missing OHCs and fused IHC hair bundles in the middle turn of the P90 Tprn−/− OC. (V) Characteristic OHC hair bundle abnormalities with shortened stereocilia of all rows. (W) Common abnormalities of IHC stereocilia: fusion (arrow) and abnormally thin taper with some stereocilia absent likely as a result of breakage at the taper (two adjacent arrows). (X) OHCs from the upper basal turn also show stereocilia fusion (arrow). (Y) Lower basal turn shows complete absence of OHCs and only a few remaining IHCs, some with fused stereocilia bundles (arrow). Scale bars in A, A′, E, F, R, U, and Y are 5 μm, and in A″, G, and N are 2 μm. Scale bars in C–C″, D–D″, H, I, K–M, P, and Q are 1 μm, and in J and O are 500 nm.
Figure S3.
Figure S3.
Histological evaluation of the Tprn −/− mouse organ of Corti (OC) shows progressive degeneration. Cross section of apical, middle, and basal turns of the cochlea of WT normal hearing Tprn+/+ mouse (left panels) and deaf Tprn−/− littermate (right panels) at P60. OC degeneration is evident at basal and middle turns of Tprn−/− cochlea. In the panel of Tprn−/− basal turn the inserts show enlarged views of the degenerated OC and spiral ganglion neurons (SG) with substantial loss of neuronal cell bodies, which is not yet observed in the middle and apical turns of the Tprn−/− cochlea. In the middle turn of Tprn−/− cochlea, the OC shows loss of all OHCs and some supporting cells. In some TPRN-deficient mice, there is a mild increase in melanin pigment in the stria vascularis (SV). All turns of Tprn+/+ cochlea show normal OC structure and normal density of spiral ganglion neurons. All scale bars are 50 µm.
Figure S4.
Figure S4.
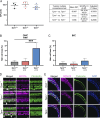
SV morphology and EP are normal in Tprn −/− mouse. (A) EP of P60 WT (Tprn+/+, two males, one female), heterozygous (Tprn+/−, two males, three females), and homozygous (Tprn−/−, three males, three females) mutant mice was within the WT range and indistinguishable between all three genotypes. Only left ears were tested in all three genotypes. (B and C) The inner ears of EP tested mice were immunostained, and the percentage of OHC and IHC loss was quantified and calculated as a fraction of number of missing hair cells out of the total number of this cell type in all images of middle and apical turn of the same ear. Error bars represent SD. One ear from each mouse was imaged and analyzed. Total of three animals were used for each genotype group. (B)Tprn−/− mice had higher percentage of OHC loss compared with the Tprn+/− and Tprn+/+. (C) No statically significant difference was observed between the percentage of IHC loss of the Tprn−/− mice with respect to the Tprn+/− and Tprn+/+. P values <0.001 were denoted with ***; unpaired two-sided t test. (D) Representative images of OC of EP tested mice of each genotype showing three rows of OHCs and one row of IHCs stained with antibody to MYO7A as a hair cell marker. Phalloidin is used to visualize the F-actin. Locations of missing OHCs are indicated by white arrows. Scale bars, 10 µm. (E) Cross-sections of the SV from the contralateral ear of EP tested animals. Cryosections stained for KCNJ10 (magenta, an intermediate cell marker), DAPI (nuclear marker), and phalloidin (green, F-actin) did not show any differences in SV staining and morphology of the Tprn−/− mice compared with the Tprn+/− and Tprn+/+ littermates. Scale bars 20 µm.
Figure S5.
Figure S5.
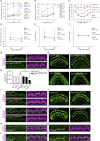
ABR thresholds of Tprn −/− , Tprn N259/N259 , and Tprnin103/in103mice and VsEP measurements of Tprn−/−mice. ANKRD24, TRIOBP-5, GPSM2, and ESPN-1 localization in WT and Tprnin103/in103postnatal hair cell stereocilia and hair bundle morphology of TPRN-deficient mice. (A) Mean ABR thresholds at P18, P30, and P60 of Tprn+/+, Tprn+/−, and Tprn−/− littermates at 8, 16, and 32 kHz. Using linear mixed effects regression, we found that Tprn−/− mice had significantly worse hearing overall (Table S2) and exhibited progressive deafness (Table S3) with greater early hearing loss at high frequencies (Tables S4 and S5). (B) Mean ABR thresholds of TprnN259/N259, Tprn+/N259, and Tprn+/+ littermate controls at P18, P30, and P60, n = number of animals tested. Similar to Tprn−/− mice, TprnN259/N259 mice exhibit worse hearing overall and a significant worsening of hearing over time (Tables S6 and S7). (C) Mean ABR thresholds of Tprnin103/in103 and WT control mice (Tprn+/+) at P21, P42, and 2 mo of age, n = number of animals tested. At all ages and frequencies, Tprnin103/in103 mice exhibited worse hearing than P60 Tprn+/+ (Tables S8 and S9). (D–F) Mean VsEP threshold (D), P1 amplitude (E), and P1 latency (F) for Tprn+/+, Tprn+/−, and Tprn−/− littermates at P30 and P60 time points. Tprn−/− mice did not exhibit significant differences in VsEP thresholds, P1 amplitudes, or P1 latencies except for a significant difference in VsEP threshold at P60 compared with Tprn+/+, P = 0.04 (Tables S10 and S11), which is likely attributable to expected test-retest variation between time points. N indicates the number of animals tested at P30/P60, correspondingly. Graphs A–F display mean ± SD. *, **, ***—significant difference compared with Tprn+/+ animals at P < 0.05, P < 0.01, and P < 0.001, respectively. Color of asterisks indicates the group exhibiting the difference. Brackets indicate differences within a genotype between time points. (G–G″) Whole mounts of cochlea from P7 WT and Tprnin103/in103 mice were stained with antibodies against TRIOBP-5 (G–G″) and phalloidin (magenta) to reveal stereocilia. (G′ and G″) Enlarged images of a representative IHC (G′) and OHC (G″) at stereocilia level. (H) Quantification of TRIOBP-5 puncta at the bases of different rows of OHC stereocilia of P7 Tprn+/+ and Tprnin103/in103 mice. Thirty-four WT and forty-two Tprn-deficient OHCs from at least three mice were analyzed per group. Data are means ± SEM. ***P < 0.001 by unpaired two-sided t test. (I–J′) Whole mounts of cochlea from P5 (I and I′) and P7 (J and J′) WT and Tprnin103/in103 mice were stained with antibodies against ANKRD24, and counterstained by phalloidin (magenta) to show F-actin of stereocilia. (I′ and J′) Enlarged images of a representative IHC at stereocilia level. Number of TRIOBP-5 and ANKRD24 puncta at bases of immature short-row stereocilia were significantly reduced in P5 and P7 Tprn-deficient hair cells. (K–L′) Cochlear whole mounts from P5 WT (K and L) and Tprnin103/in103 mice (K′ and L′) were stained for GPSM2 (K and K′) or ESPN-1 (L and L′), which is localized at tips of stereocilia. No significant change of GPSM2 or ESPN-1 localization was observed in Tprn-deficient mice (K′ and L′). Scale bars are 5 µm.
Figure 7.
Figure 7.
Localization of TPRN in hair cells lacking PTPRQ and interaction of TPRN and PTPRQ in live cells. (A and B) Localization of TPRN in P15 normal hearing heterozygous littermate (Ptprq+/) and deaf Ptprq knockout mouse (Ptprq−/−) OHCs was examined using anti-TPRN antibodies PB913 and C9ORF75. Both antibodies gave identical staining showing TPRN is concentrated at the base of OHC stereocilia in both Ptprq+/ (A) and Ptprq−/− (B) mouse OC and visualized as green puncta. (C) Bar graph showing quantification of number of TPRN puncta in OHCs for both genotypes. Ptprq+/−n = 137/3 puncta/cells and Ptprq−/−n = 77/3 puncta/cells. Number of TPRN puncta at bases of OHC stereocilia was significantly reduced in P15 Ptprq−/− mice compared with Ptprq+/− controls as revealed by unpaired two-sided t test (***P = 0.0005). (D and E) Bar graph of mean fluorescence intensity of individual puncta showing no statistically significant differences between genotypes by unpaired two-sided t test (P = 0.4338). Imaris software spot function was used to calculate the number of puncta per cell for each genotype. ImageJ (Fiji) was used to calculate mean fluorescence intensity value of puncta for each genotype to compare the differences in TPRN expression in Ptprq+/− control and Ptprq−/− knockout mice. (F and G) TPRN localization at the base of IHC stereocilia in P15 Ptprq+/− control (F) and Ptprq−/− knockout mouse (G). (H–J) Quantification of number of TPRN puncta (H) and mean fluorescence intensity of puncta (I and J) in IHCs for both genotypes. Mean TPRN fluorescence intensity of TPRN puncta was significantly reduced in P15 Ptprq−/− knockout mouse IHCs (**P = 0.0015 by unpaired two-sided t test) but no significant differences were found in number of TPRN puncta in IHC stereocilia, 129/3, number of puncta/cells (Ptprq+/) and 137/3 number of puncta/cells (Ptprq−/−) between the genotypes (P = 0.6489 by unpaired two-sided t test). Data are represented as mean ± SD. Puncta from three cells per genotype and three for each hair cell type were analyzed. (K) mCherry-MYO10-TPRN fusion construct (magenta) expressed in COS-7 cells targets filopodia tips and co-localizes there with EGFP-PTPRQ (green). (L) Control mCherry-MYO10HMM does not target PTPRQ protein to filopodia tips when co-expressed together, confirming that PTPRQ is delivered to the filopodia tips due to its interaction with TPRN (K). (M) Overexpressed mCherry-TPRN (magenta) interacts with EGFP-PTPRQ (green), transports PTPRQ to the nucleus, and forms a whorl-like bundle where both TPRN and PTPRQ co-localize. The experiments were performed at least three times, yielding consistent results. All scale bars are: 5 µm; scale bar in B applies to A, B, F, and G; scale bar in M applies to L and M.
Figure 8.
Figure 8.
Abnormal stereocilia development due to constitutive absence or long-term overexpression of TPRN in vivo. (A and B) Whole mounts of cochlea from P7 WT or Tprn−/− mice were stained with antibodies against TRIOBP-5 (green) and phalloidin (magenta) to reveal stereocilia. (A′–B′) Enlarged images of the OHC hair bundles indicated by arrows in A and B. (A″–B″) Enlarged images of the IHC hair bundles indicated by arrows in A and B. Number of TRIOBP-5 puncta at bases of immature short-row stereocilia was significantly reduced in P7 Tprn-deficient hair cells. Two arrows point to immature stereocilia rows in A′ compared with B′ and in A″ compared with B″. (C) Quantification of TRIOBP-5 puncta at the bases of different rows of stereocilia in P7 Tprn+/+ and in Tprn-deficient mouse model Tprnin103/in103. Fifty-six WT and Tprn-deficient IHCs from at least three mice were analyzed per group. Data are means ± SEM. ***P < 0.001 by unpaired two-sided t test. (D–G) Cochlear whole mounts from P1 (D and E) or P3 (F and G) of Tprn+/+ and Tprnin103/in103 mice immunostained for TRIOBP-5 and counterstained for F-actin using phalloidin. (D′–E′) Enlarged images of TRIOBP-5–stained IHC bundles in D and E. (F–G′) As early as P3, there was a reduction of TRIOBP-5 puncta at the base of short-row stereocilia of Tprn-deficient mice, better appreciated on enlarged images (F′–G′). (H and I) Representative SEM images of IHC stereocilia bundles from the middle turn of the cochlea of P7 WT (H) and Tprnin103/in103 (I) mice. (J) Quantification of the number of stereocilia in different rows. At least 48 IHCs from three mice in each group were analyzed. Data are represented as mean ± SEM. ***P < 0.001 by unpaired two-sided t test. (K and K′) A low-magnification image showing stereocilia of P7 WT hair cells infected at P2 with AAVs expressing FL HA-TPRN. On average, 64.9 ± 6.5% of IHCs exhibited excessive stereocilia elongation. A total of three mice were analyzed, and 27–64 IHCs were assessed in the apical region of the cochlea of each mouse. Arrows indicate cells with apparently normal stereocilia, likely due to the absence of AAV transduction. (L and L′) Degeneration of P7 WT IHC stereocilia infected at P2 with AAVs expressing FL HA-TPRN. (K–L′) Hair cells are counterstained with phalloidin to reveal F-actin and an anti-HA antibody to detect HA-TPRN (green). (M–Q) P7 WT hair cells infected at P2 with AAVs expressing HA-TPRN1–400 (M), HA-TPRN1–300 (N), HA-TPRN1–170 (O), TPRN1–63 (P), or tdTomato (Q). Note, multiple rows of TRIOBP-5 puncta in hair cells expressing TPRN1–400, TPRN1–300, or TPRN1–170. (N) Extra rows of TRIOBP-5 puncta are visualized at the apical surface of infected cells (arrows point to row 5 stereocilia) as compared with a noninfected cell in the middle of the image in N or cells expressing TPRN1–63 or tdTomato (P and Q). (R–S) SEM images of P7 WT noninfected (R) and infected with AAVs expressing HA-TPRN1–170 (R′ and S) hair cells. On average, 5.5 ± 2.1% of IHCs exhibited negligible changes to the hair bundle, 87.4 ± 2.7% exhibited supernumerary rows of short stereocilia with increased thickness (R′), and 7.0 ± 2.9% showed over-elongated stereocilia (S). A total of five mice were analyzed, and 32–41 IHCs were assessed in the apical region of the cochlea of each mouse. Scale bars: 5 µm in A–Q, except 1 µm in H, I, R, and S. (T) Relative intensity of TRIOBP-5 in rows 1–3. Significantly increased intensity of TRIOBP in row 3 stereocilia in hair cells expressing TPRN1–400, TPRN1–300, or TPRN1–170. Data are represented as mean ± SEM. ***P < 0.001 by unpaired two-sided t test. tdTomato: n.s. P = 0.4854. TPRN1–63: n.s. P = 0.0504. WT, TPRN1–400, and TPRN1–300n = 47/3 cells/mice; TPRN1–170 and tdTomato n = 50/3 cells/mice; and TPRN1–63n = 30/3 cells/mice.
Figure 9.
Figure 9.
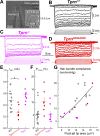
TPRN deficiency has little effect on MET currents and stereocilia bundle stiffness in young postnatal OHCs. (A) Bright field image on an OC explant with a patch-clamp pipette (right) and fluid-jet deflecting the OHC stereocilia bundles (bottom). Inset shows a representative frame from a high-speed video recording sequence used to quantify stereocilia bundle movement and to determine positioning of the fluid-jet relative to the hair bundle (see Materials and methods). (B–D) Representative MET currents to fluid-jet stimuli evoked by step-like voltage commands in OHCs of control Tprn+/+ (B), Tprn−/− (C), and TprnN259/N259 (D) mice. (E and F) Maximal MET current (E) and open MET channel probability at resting bundle position, POPEN control Tprn+/+ (open black circles), Tprn−/− (closed magenta circles), and TprnN259/N259 (closed red circles) mice. Data from individual cells and mean ± SEM are shown. Asterisk shows statistical significance: *P < 0.05; unpaired two-sided t test. (G) Relationship between stereocilia bundle compliance and the tip area of the fluid-jet pipette that determines the force applied to the bundle. Hair bundle compliances were calculated from linear fits of relationships between hair bundle displacement and fluid-jet pressure around resting bundle positions (0–100 nm deflections). All data show the same parabolic function. Age of the cells: P4–P7, location along the cochlea: middle of the apical turn, number of tested cells/mice: WT 12/8; Tprn−/− 6/2; TprnN259/N259 3/3.
Figure 10.
Figure 10.
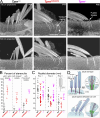
Abnormalities of stereocilia rootlets and taper regions evoked by TPRN deficiency. (A) Ultrastructural features of stereocilia tapers and rootlets in control (left), TprnN259/N259 (middle), and Tprn−/− (right) IHCs. Images represent maximum intensity projections of the stacks of individual FIB-SEM sections with ∼2 × 2 × 20-nm resolution through different overall thicknesses: 1.6 µm (top) and 400 nm (bottom). Arrows point to three typical abnormalities of the rootlets in TPRN-deficient IHCs: (1) “kinks” in the lower portion of the rootlet within cuticular plate, (2) branching at the lower end of the rootlet, and (3) F-actin breaks at stereocilia pivot points. All scale bars are 500 nm. The age of IHCs (P17, P32, or P34) is indicated. (B) Percentages of stereocilia with F-actin breaks at the pivot points (left), abnormal kinked rootlets (middle), and branched rootlets (right) in WT (n = 8/3, cells/mice, black open circles), TprnN259/N259 (n = 3/2, cells/mice, red closed circles), and Tprn−/− (n = 2/1, cells/mice, magenta closed circles) IHCs. In all three categories (F-actin breaks, kinked and branched rootlets), the difference between genotypes was highly significant (P < 0.001, one-way ANOVA). Asterisks show significance of the differences from the WT (post hoc Bonferroni test: **P < 0.01; ***P < 0.001; n.s., not significant). (C) Diameters of the lower portion of rootlets were quantified by measuring at the level of 100-nm down from IHC stereocilia pivot points (schematic in the inset of C) in the same WT, TprnN259/N259, and Tprn−/− IHCs as in B. Each point is one rootlet. The decrease in diameters of rootlets from in rows 1 and 2 of TprnN259/N259 stereocilia was significantly different from WT (P < 0.0001, one-way ANOVA, post hoc Bonferroni test: ***P < 0.001; n.s., not significant). P17 TprnN259/N259 and P32 Tprn−/− IHCs were processed and analyzed in parallel with corresponding WT IHCs (n = 4 for each group). Since no statistically significant differences were found between P17 and P34 for the WT, the data for WT were combined. (D) Drawings illustrate adult WT (top) and adult TPRN-deficient (bottom) stereocilia with magnified views of their rootlets and tapers and localization of stereocilia base proteins discussed in this study. The enlarged view of a WT stereocilia taper region is shown in a circle of top panel. In the bottom panel, an enlarged image shows details of structural disruptions at the taper region in the absence of TPRN.

References

    1. Allen, P.B., Greenfield A.T., Svenningsson P., Haspeslagh D.C., and Greengard P.. 2004. Phactrs 1-4: A family of protein phosphatase 1 and actin regulatory proteins. Proc. Natl. Acad. Sci. USA. 101:7187–7192. 10.1073/pnas.0401673101 - DOI - PMC - PubMed
    1. Ashmore, J. 2004. Hearing: Channel at the hair’s end. Nature. 432:685–686. 10.1038/432685a - DOI - PubMed
    1. Bashir, R., Imtiaz A., Fatima A., Alam A., and Naz S.. 2013. The c.42_52del11 mutation in TPRN and progressive hearing loss in a family from Pakistan. Biochem. Genet. 51:350–357. 10.1007/s10528-013-9568-y - DOI - PMC - PubMed
    1. Belyantseva, I.A. 2016. Helios(®) gene gun-mediated transfection of the inner ear sensory epithelium: Recent updates. Methods Mol. Biol. 1427:3–26. 10.1007/978-1-4939-3615-1_1 - DOI - PubMed
    1. Belyantseva, I.A., Boger E.T., and Friedman T.B.. 2003. Myosin XVa localizes to the tips of inner ear sensory cell stereocilia and is essential for staircase formation of the hair bundle. Proc. Natl. Acad. Sci. USA. 100:13958–13963. 10.1073/pnas.2334417100 - DOI - PMC - PubMed

LinkOut - more resources