

Low-Intensity Physical Exercise is Associated with Improved Myelination and Reduced Microglial Activation in a Cuprizone-Induced Demyelination Model
- PMID: 40471423
- PMCID: PMC12141394
- DOI: 10.1007/s11064-025-04441-8
Low-Intensity Physical Exercise is Associated with Improved Myelination and Reduced Microglial Activation in a Cuprizone-Induced Demyelination Model
Abstract
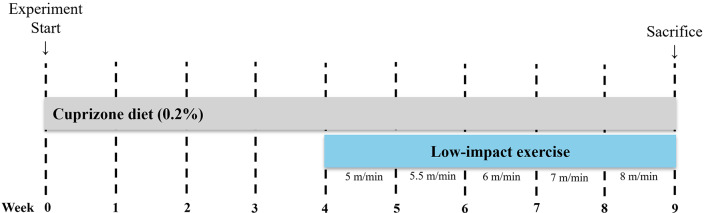
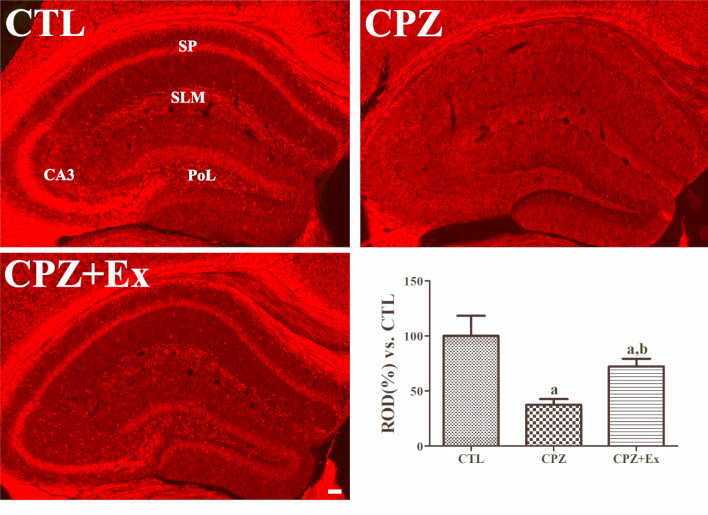
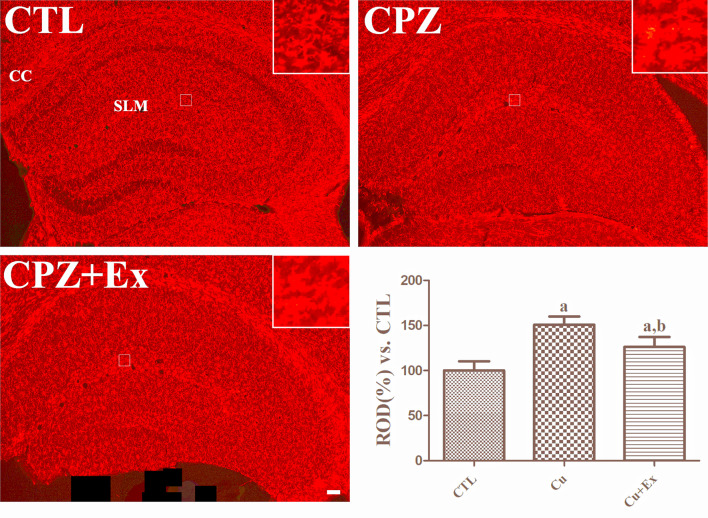
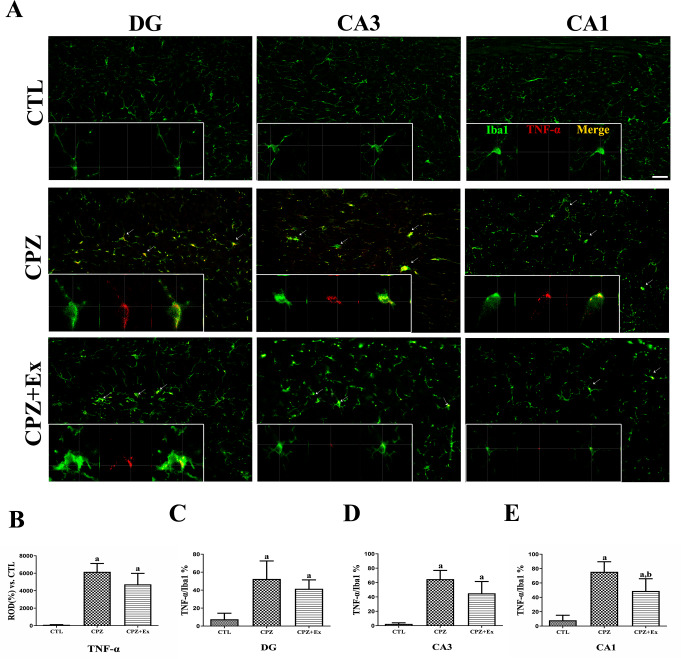
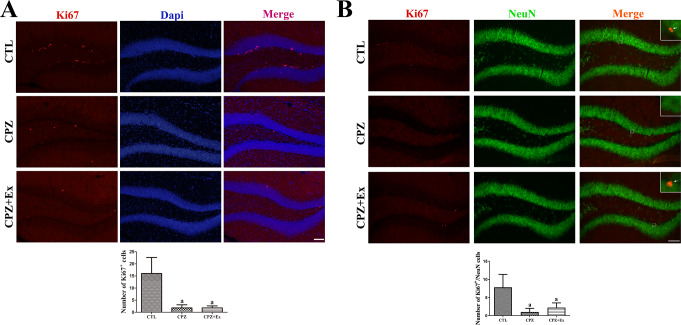
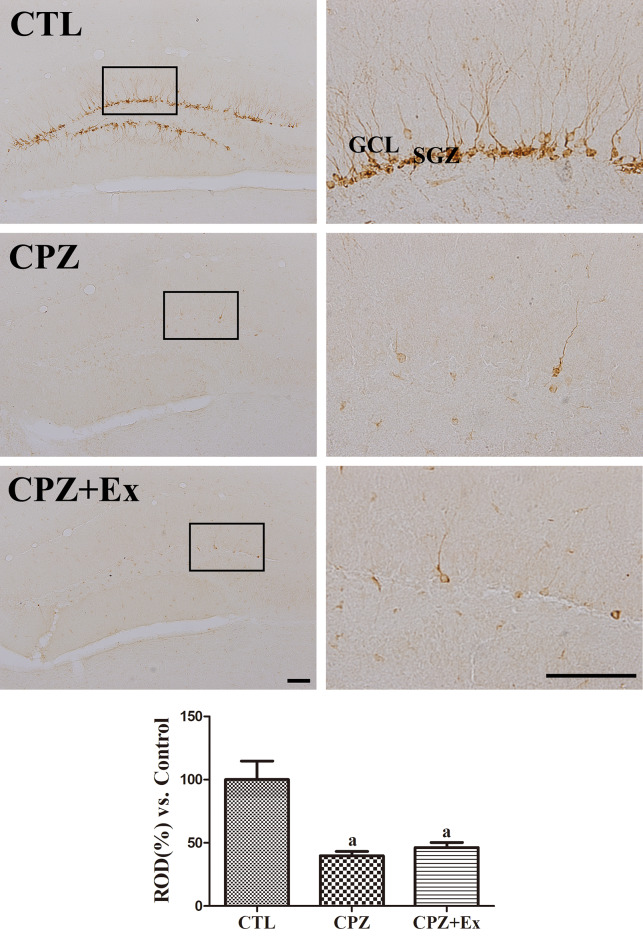
Demyelinating diseases like multiple sclerosis cause damage to the myelin sheath, leading to neurological problems. While the exact causes of MS are unclear, it is known that inflammatory processes and poor remyelination contribute to disease progression. Exercise has shown promise as a non-drug treatment for MS, with benefits reported for mobility, mood, and potential neuroprotection. However, the specific ways in which exercise affects remyelination and neuroinflammation in demyelinating conditions are not fully understood. This study explores the effects of low-intensity physical exercise on myelination, neuroinflammation, and neurogenesis in a cuprizone-induced demyelination model, focusing on the hippocampus, which are critical for cognitive function and interhemispheric communication. Mice subjected to cuprizone treatment underwent a low-intensity forced wheel-running exercise. The results showed that low-intensity physical exercise significantly increased the expression of myelin basic protein in the stratum lacunosum-moleculare of the hippocampus and the corpus callosum, suggesting enhanced remyelination in these regions. Additionally, cuprizone-induced demyelination led to morphological changes in microglia, activating them in the hippocampus. However, low-intensity physical exercise significantly reduced microglial activation, indicating that exercise modulated the neuroinflammatory response. Despite observing reduced microglial activation with low-intensity exercise, TNF-α levels remained elevated in the low-intensity exercise group, suggesting a complex relationship between microglial activation markers and cytokine production in this model of demyelination. This indicates that low-intensity exercise may not fully suppress the pro-inflammatory potential of microglia in the cuprizone model. Although low-intensity exercise promoted remyelination and modulated neuroinflammation in the cuprizone-induced demyelination model, it did not significantly counteract the cuprizone-induced reduction in proliferating cells and immature neurons in the subgranular zone of the dentate gyrus. These findings suggest that while the exercise regimen had beneficial effects, it did not significantly influence overall neurogenesis. This novel study investigates the region-specific effects of low-intensity exercise on myelination and neuroinflammation, with a focus on the hippocampus, which is less frequently explored in the context of demyelination models. The findings highlight the potential rehabilitative benefits of low-intensity exercise for demyelination-related neurological disorders and provide new insights into the underlying mechanisms contributing to neuroprotection.
Keywords: Cuprizone; Low-intensity exercise; Neurogenesis; Remyelination.
© 2025. The Author(s).
Conflict of interest statement
Declarations. Competing Interests: The authors declare no competing interests.
Figures
Similar articles
-
Single intracerebroventricular TNFR2 agonist injection impacts remyelination in the cuprizone model.J Mol Med (Berl). 2025 Jul;103(7):795-807. doi: 10.1007/s00109-025-02549-6. Epub 2025 May 10. J Mol Med (Berl). 2025. PMID: 40347238 Free PMC article.
-
Targeting the PAC1 receptor mitigates degradation of myelin and synaptic markers and diminishes locomotor deficits in the cuprizone demyelination model.J Neurochem. 2024 Sep;168(9):3250-3267. doi: 10.1111/jnc.16199. Epub 2024 Aug 8. J Neurochem. 2024. PMID: 39115025
-
Dihydroartemisinin enhances remyelination by switching microglia to the reparative phenotype.J Neuroinflammation. 2025 Aug 1;22(1):197. doi: 10.1186/s12974-025-03510-7. J Neuroinflammation. 2025. PMID: 40750890 Free PMC article.
-
Home treatment for mental health problems: a systematic review.Health Technol Assess. 2001;5(15):1-139. doi: 10.3310/hta5150. Health Technol Assess. 2001. PMID: 11532236
-
Physical activity and exercise for chronic pain in adults: an overview of Cochrane Reviews.Cochrane Database Syst Rev. 2017 Apr 24;4(4):CD011279. doi: 10.1002/14651858.CD011279.pub3. Cochrane Database Syst Rev. 2017. PMID: 28436583 Free PMC article.
Cited by
-
Spinal Cord Injury Remyelination: Pathways to Therapies.Int J Mol Sci. 2025 Jul 26;26(15):7249. doi: 10.3390/ijms26157249. Int J Mol Sci. 2025. PMID: 40806380 Free PMC article. Review.
References
MeSH terms
Substances
LinkOut - more resources
Full Text Sources
