. 2025 Jun 5;135(15):e175566.
doi: 10.1172/JCI175566. eCollection 2025 Aug 1.

The microRNA miR-30a blocks adipose tissue fibrosis accumulation in obesity

Affiliations

The microRNA miR-30a blocks adipose tissue fibrosis accumulation in obesity

Pradip K Saha et al. J Clin Invest. .

Abstract

White adipose tissue (WAT) fibrosis occurring in obesity contributes to the inflammatory and metabolic comorbidities of insulin resistance and type 2 diabetes, yet the mechanisms involved remain poorly understood. Here, we report a role for the broadly conserved miRNA miR-30a as a regulator of WAT fibrosis and systemic glucose metabolism. Mice modified to express miR-30a at elevated levels in adipose tissues maintain insulin sensitivity coupled with reduced fatty liver disease when fed a high-fat diet. These effects were attributable to cell-autonomous functions of miR-30a that potently increase expression of adipocyte-specific genes. Proteomic screening revealed miR-30a limits profibrotic programs in subcutaneous WAT, at least in part, by repressing PAI-1, a dominant regulator of fibrinolysis and biomarker of insulin resistance. Conversely, mouse adipocytes lacking miR-30a exhibited greater expression of fibrosis markers with disrupted cellular metabolism. Lastly, miR-30a expression negatively correlates with PAI-1 levels in subcutaneous WAT from people with obesity, further supporting an antifibrotic role for miR-30a. Together, these findings uncover miR-30a as a critical regulator of adipose tissue fibrosis that predicts metabolically healthy obesity in people and mice.

Keywords: Adipose tissue; Cell biology; Fibrosis; Metabolism; Noncoding RNAs.


Conflict of interest statement

Conflict of interest: The authors have declared that no conflict of interest exists.

Figures

Figure 1
Figure 1. Enforced miR-30a expression increases adipocyte differentiation.
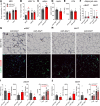
(A) Southern blot was performed with embryonic stem cell genomic DNA digested with EcoRV and 5′ probe. Targeting of the lox-stop-lox–miR-30a to the Rosa26 locus generated 2 bands. (B) Adv-iCre deleted the STOP cassette and allowed transgenic miR-30a expression in iWAT SVF-derived adipocytes (n = 6/group). (C) mRNA expression of selected adipocyte differentiation markers (n = 3/group). (D) Cre immunoblotting was performed and quantified (n = 3) to confirm transduction, along with markers of mature fat cells. HSP90 served as the loading control. (E) Lipid accumulation within differentiated adipocytes was visualized by ORO for gross effects (left) and deconvolution microscopy (right). Fluorescent dyes are mitochondria (MTx) (green), perilipin (red), and nuclei (DAPI; blue). Scale bars: 20 µm. All data are represented as the mean ± SEM.*P < 0.05, by 2-tailed (C) or 1-sided (D) unpaired Student’s t test versus Adv-GFP. Rel, relative.
Figure 2
Figure 2. Conditional miR-30a transgenesis in WAT maintains insulin sensitivity in obesity.
(A) Copy number analysis per 10 ng RNA of miR-30 family members in WAT and liver of miR-30afat mice after 18 weeks of an HFD (n = 6/group). A log scale is shown. (B) Body weight of male miR-30aL/L and miR-30afat mice during HFD feeding (n = 10–16/group). Mice were individually housed and monitored in CLAMS-HC metabolic cages for 3 days (n = 10/group, unless otherwise noted). (C) Cumulative food intake (g) and (D) recorded traces of O2 consumption (mL/h) (n = 5/group). (E) Average O2 consumption and (F) RER during light and dark periods (n = 10/group). Data were analyzed with CalR and ANCOVA using lean mass as covariate for O2 consumption. (G) Glucose (GTT) and (H) insulin (ITT) tolerance tests (n = 16–21/group) with corresponding (I) 4-hour fasting serum insulin (n = 6/group) in miR-30aL/L and miR-30afat after 18 weeks of an HFD. (J) Liver sections were stained with ORO to analyze steatosis in male miR-30aL/L and miR-30afat mice after HFD feeding. Reduced fat content in the liver (n = 5–6/group) was confirmed by measurement of (K) hepatic TGs and (L) cholesterol (Chol). (M) Quantitative PCR was used to determine the expression of lipogenic genes in the liver (n = 5–6/group). All data are represented as the mean ± SEM. *P < 0.05, by 2-tailed, unpaired Student’s t test (A, C, I, K, L, and M). *P < 0.05, #P < 0.10, by 2-way ANOVA with Tukey’s multiple-comparison test (B, F, G, and H). VO2, oxygen consumption.
Figure 3
Figure 3. miR-30a expression expands iWAT during HFD feeding.
(A)Mice fed an HFD for 18 weeks underwent MRI (n = 10/group) to measure whole-body lean and fat mass. (B) Tissue weights from male miR-30aL/L and miR-30afat mice (n = 7–8/group) at necropsy. Serum levels of adiponectin (adipn) (n = 9–12) (C), leptin (n = 5) (D), and free fatty acid (FFA) (n = 6) (E) after feeding. (F) Mean adipocyte size (μm2) measured across 4 fields of view (n = 3/group) from (G) eWAT and (H) iWAT sectioning and immunohistochemistry. (G and H) WAT was stained for Mac3 (upper rows; scale bars: 50 μm) or CD11c and CD206 (lower rows; scale bars: 100 μm). (I) eWAT and (J) iWAT quantification of Mac3 staining (%area; n = 4/group) or CD11c and CD206 intensities (n = 4/group). (I and J) The bar charts also include analysis of T cells and macrophages in the WAT SVF quantified by flow cytometry (n = 6–7 mice/group). All data are represented as the mean ± SEM. *P < 0.05, by 2-way ANOVA with Tukey’s multiple-comparison test (A and B). *P < 0.05, by 2-tailed, unpaired Student’s t test (CF, I, and J).
Figure 4
Figure 4. Local antifibrotic effects associated with enforced miR-30a expression in subcutaneous WAT of obese mice.
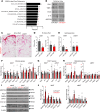
(A) Gene set enrichment analysis (GSEA) of altered proteins (*P < 0.05 for miR-30afat/miR-30aL/L; n = 4/group) identified signatures depleted by transgenic miR-30a expression in the iWAT of obese mice. (B) iWAT protein lysates (pooled n = 4/group) were incubated with cytokine arrays to follow up the proteomic screen. (C) Sirius red staining in the iWAT and eWAT after HFD feeding for 18 weeks. Scale bars: 50 μm. eWAT and iWAT (D) quantification of percentage of Picrosirius red staining (%area; n = 3–4/group) and hydroxyproline content (E) by mass spectrometry (n = 6/group, relative to miR-30aL/L). Expression profiles of profibrotic (F), STAT1 targets (G), and metabolic genes (H) (n = 6/group) in the iWAT and eWAT after HFD feeding for 18 weeks (n = 6/group). (I) Western blotting with indicated antibodies and associated quantification (J) to validate changes in fibrosis markers with independent WAT protein lysates. HSP90 and β-actin served as invariant protein controls. All data are represented as the mean ± SEM. *P < 0.05 and #P < 0.10, by 2-tailed, unpaired Student’s t test (DH and J). Rel, relative.
Figure 5
Figure 5. PAI-1 is a direct target of miR-30a.
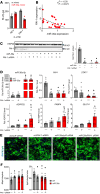
(A) Plasmids with negative control (RO1) and PAI-1 3′ UTR luciferase fusions were cotransfected with miR-30a or control (nt) mimics in human adipocytes. *P < 0.05, by 2-way ANOVA with Tukey’s multiple-comparison test. (B) Relative miR-30a and PAI-1 expression measured in subcutaneous adipose tissue from humans. *P value for Pearson’s r < 0.05 by t test performed on the linear regression. (CF) Human adipocytes were transfected with siRNA to PAI-1 ± miR-30a mimics for 48 hours. (C) Western blotting and with PAI-1 antibodies and associated quantification. HSP90 served as invariant protein controls. (D) mRNA expression of selected adipocyte marker genes, STAT1, and PAI-1 in adipocytes (n = 5–6/group). (E) Representative images from high-throughput microscopy (HTM) following immunofluorescence labeling of lipid droplets (green, BODIPY) and nuclei (blue, DAPI) of human adipocytes treated with siRNA to PAI-1 ± miR-30a mimics. Scale bars: 50 µm. (F) High-content analysis of differentiated adipocytes from HTM: number of lipid droplets and mean lipid droplet size (n = 12–15 replicates/group). All data are represented as the mean ± SEM. P < 0.05 versus acontrol mimics/scRNA and btransfection of individual siRNA PAI-1 or miR-30a mimics, by 2-way ANOVA with Tukey’s multiple-comparison test (C, D, and F). Ctrl, control; nt,nontargeting.
Figure 6
Figure 6. Knockout of miR-30a de-represses fibrosis genes and blocks adipocyte differentiation.
(A) iWAT Sirius red staining and mean adipocyte size (μm2) measured across 4 fields of view (n = 3/group) of miR-30a–/– or miR-30a+/+ littermate controls after HFD feeding for 12 weeks. Scale bars: 50 μm. (B) Quantification of percentage of Picrosirius red staining (%area; n = 3/group, relative to miR-30a+/+). (C) Hydroxyproline content by mass spectrometry (n = 5–6/group). (D) Expression profiles of pro-fibrotic and metabolic genes (n = 7–8/group) in the iWAT of miR-30a–/– or miR-30a+/+ littermate controls after HFD feeding for 12 weeks. (E) Reverse phase protein array (RPPA) analysis performed on iWAT shown as fold change miR-30a–/–/miR-30a+/+. SVF-derived adipocytes were prepared from miR-30a+/+ and miR-30a–/– mice. (F) Differentiated miR-30a+/+ and miR-30a–/– cells were stained with ORO to characterize lipid accumulation. (G) Adipocytes were stained and imaged using deconvolution microscopy to identify mitochondria (red), lipid (green), and nuclei (blue). Scale bars: 50 µm. (H) Oxygen consumption rate (OCR) in differentiated miR-30a+/+ and miR-30a–/– mice with addition of oligomycin, carbonyl cyanide-4-(trifluoromethoxy) phenylhydrazone and antimycin-A/rotenone (n = 4/group). All data are represented as the mean ± SEM. *P < 0.05, by 2-way ANOVA with Tukey’s multiple-comparison test. (I) mRNA expression of selected adipocyte differentiation and fibrosis markers in SVF-derived adipocytes (n = 3/group). *P < 0.05, by 2-tailed, unpaired Student’s t test (AE and I).

References

    1. Klein S, et al. Why does obesity cause diabetes? Cell Metab. 2022;34(1):11–20. doi: 10.1016/j.cmet.2021.12.012. - DOI - PMC - PubMed
    1. Acosta JR, et al. Increased fat cell size: a major phenotype of subcutaneous white adipose tissue in non-obese individuals with type 2 diabetes. Diabetologia. 2016;59(3):560–570. doi: 10.1007/s00125-015-3810-6. - DOI - PubMed
    1. Arner E, et al. Adipocyte turnover: relevance to human adipose tissue morphology. Diabetes. 2010;59(1):105–109. doi: 10.2337/db09-0942. - DOI - PMC - PubMed
    1. Isakson P, et al. Impaired preadipocyte differentiation in human abdominal obesity: role of Wnt, tumor necrosis factor-alpha, and inflammation. Diabetes. 2009;58(7):1550–1557. doi: 10.2337/db08-1770. - DOI - PMC - PubMed
    1. Lessard J, et al. Low abdominal subcutaneous preadipocyte adipogenesis is associated with visceral obesity, visceral adipocyte hypertrophy, and a dysmetabolic state. Adipocyte. 2014;3(3):197–205. doi: 10.4161/adip.29385. - DOI - PMC - PubMed