

Shifts in phytoplankton community structure across oceanic boundaries
- PMID: 40471890
- PMCID: PMC12140190
- DOI: 10.1371/journal.pone.0324466
Shifts in phytoplankton community structure across oceanic boundaries
Abstract
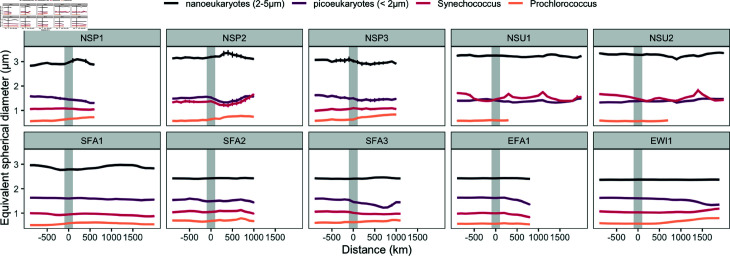
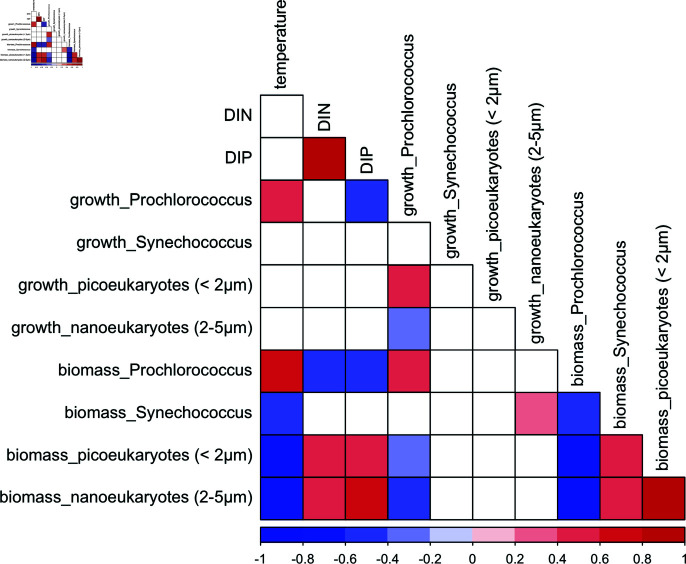
Phytoplankton communities play an important role in marine food webs and biogeochemical cycles. The transition zones between ocean gyres and surrounding waters represent critical ecological boundaries where environmental gradients drive significant shifts in phytoplankton community structure. This study investigates how nutrient availability and temperature shape the size distribution and composition of small phytoplankton (< 5 [Formula: see text]m) communities across the North Pacific Subtropical Gyre (NPSG) boundaries, testing several ecological hypotheses that explain phytoplankton size distribution patterns in relation to environmental variability. We used high-resolution, underway flow cytometry data collected during eight oceanographic cruises from 2016 to 2021 to assess changes in phytoplankton biomass and growth rate across the gyre boundaries. The cyanobacterium Prochlorococcus dominated within the gyre, with biomass ranging from 3.2 to 13.1 [Formula: see text]gC L-1, and its relative contribution to total phytoplankton biomass varied among cruises (31% to 81%, average 60 [Formula: see text] 16%). Prochlorococcus growth rates were significantly higher within the gyre (0.43 [Formula: see text] 0.18 per day) than outside the gyre (0.28 [Formula: see text] 0.16 per day) (one-sided t-test, p < 0.001). Northward in the gyre, Prochlorococcus biomass and growth rates declined. Some variations in biomass and growth rates were observed southward and eastward, with biomass ranging from 3 to 10 [Formula: see text]gC L-1 and growth rate ranging from 0.2 to 0.6 per day. Outside the NPSG, total phytoplankton biomass increased, with nanoeukaryotes becoming the predominant contributors (up to 71%, 9.1 [Formula: see text] 7.3 [Formula: see text]gC L-1). Picoeukaryote biomass also increased outside the gyre (up to 28 [Formula: see text] 12% of total biomass). Nutrient concentrations increased by nearly two orders of magnitude outside the NPSG, coinciding with the shift towards larger phytoplankton. The dominance of Prochlorococcus within the gyre emphasizes its adaptation to oligotrophic conditions, while the shift towards larger size classes outside the gyre likely reflects the relatively higher nutrient availability. The relatively low abundance of Synechococcus even in nutrient-rich regions suggest that that factors beyond nutrient availability, such as grazing, may influence its distribution. These findings have implications for understanding how phytoplankton communities will respond to future changes in oceanographic conditions, such as warming and altered nutrient regimes.
Copyright: © 2025 Winter et al. This is an open access article distributed under the terms of the Creative Commons Attribution License, which permits unrestricted use, distribution, and reproduction in any medium, provided the original author and source are credited.
Conflict of interest statement
The authors have declared that no competing interests exist.
Figures


Similar articles
-
Latitudinal variation in virus-induced mortality of phytoplankton across the North Atlantic Ocean.ISME J. 2016 Feb;10(2):500-13. doi: 10.1038/ismej.2015.130. Epub 2015 Aug 11. ISME J. 2016. PMID: 26262815 Free PMC article.
-
Oceanographic basis of the global surface distribution of Prochlorococcus ecotypes.Science. 2006 May 12;312(5775):918-21. doi: 10.1126/science.1122692. Science. 2006. PMID: 16690867
-
Emergent biogeography of microbial communities in a model ocean.Science. 2007 Mar 30;315(5820):1843-6. doi: 10.1126/science.1138544. Science. 2007. PMID: 17395828
-
Prochlorococcus: advantages and limits of minimalism.Ann Rev Mar Sci. 2010;2:305-31. doi: 10.1146/annurev-marine-120308-081034. Ann Rev Mar Sci. 2010. PMID: 21141667 Review.
-
Cell size as a key determinant of phytoplankton metabolism and community structure.Ann Rev Mar Sci. 2015;7:241-64. doi: 10.1146/annurev-marine-010814-015955. Epub 2014 Jul 25. Ann Rev Mar Sci. 2015. PMID: 25062405 Review.
References
-
- Karl DM. Minireviews: a sea of change: biogeochemical variability in the North Pacific Subtropical Gyre. Ecosystems. 1999;2(3):181–214. doi: 10.1007/s100219900068 - DOI
-
- Chisholm S. Phytoplankton size. Primary productivity and biogeochemical cycles in the sea. New York: Springer US. 1992. p. 213–37.
-
- Dao M. Reassessment of the cell surface area limitation to nutrient uptake in phytoplankton. Mar Ecol Prog Ser. 2013;489:87–92. doi: 10.3354/meps10434 - DOI
-
- Rii Y, Karl D, Church M. Temporal and vertical variability in picophytoplankton primary productivity in the North Pacific Subtropical Gyre. Mar Ecol Prog Ser. 2016;562:1–18. doi: 10.3354/meps11954 - DOI
MeSH terms
LinkOut - more resources
Full Text Sources
Miscellaneous
