. 2025 May 1;26(3):bbaf253.
doi: 10.1093/bib/bbaf253.

ScInfeR: an efficient method for annotating cell types and sub-types in single-cell RNA-seq, ATAC-seq, and spatial omics

Affiliations

ScInfeR: an efficient method for annotating cell types and sub-types in single-cell RNA-seq, ATAC-seq, and spatial omics

Asish Kumar Swain et al. Brief Bioinform. .

Erratum in

Abstract

Cell-type annotation remains a major challenge in single-cell and spatial omics analysis. Most existing methods rely on single-cell RNA sequencing (scRNA-seq) references or predefined marker sets. However, the scarcity of high-quality scRNA-seq references and marker sets makes relying on a single approach prone to bias and limits usability. Furthermore, available methods for cell-type annotation in single-cell ATAC-sequencing (scATAC-seq) and spatial transcriptomics datasets perform poorly. Here, we present ScInfeR, a graph-based cell-type annotation method that combines information from both scRNA-seq references and marker sets. By integrating these two data sources, ScInfeR can accurately annotate broad range of cell-types. It employs a hierarchical framework inspired by message-passing layers in graph neural networks to accurately identify cell subtypes. ScInfeR is highly versatile, supporting cell annotation across scRNA-seq, scATAC-seq, and spatial omics datasets. For scATAC-seq, it effectively utilizes chromatin accessibility data, while for spatial transcriptomics, it incorporates spatial coordinate information. Additionally, ScInfeR supports weighted positive and negative markers, allowing users to define marker importance in cell-type classification. Our extensive benchmarking across multiple atlas-scale scRNA-seq, scATAC-seq, and spatial datasets, evaluating 10 existing tools in over 100 cell-type prediction tasks, demonstrated ScInfeR's superior performance. Noteworthy, it exhibits robustness against batch effects arising in these datasets. To facilitate seamless annotation, we developed ScInfeRDB, an interactive database containing manually curated scRNA-seq references and marker sets for 329 cell-types, covering 2497 gene markers in 28 tissue types from human and plant. ScInfeR is available as an R package, with both the tool and database publicly accessible at https://www.swainasish.in/scinfer.

Keywords: cell type annotation; scATAC-seq; scRNA-seq; spatial transcriptomics.


Conflict of interest statement

The authors declare that they have no conflict of interest.

Figures

Figure 1
Figure 1
Overview of the ScInfeR workflow: (a) ScInfeR framework takes scRNA-seq, or single-cell ATAC-sequencing (scATAC-seq), or spatial omics expression matrix as input for cell type inference; (b) a cell marker set or scRNA-seq reference matrix is used as secondary input for cell type guidance. Both of these can be retrieved from our ScInfeRDB database. In case, scRNA-seq reference is input, ScInfeR could calculate the cell marker set; (c) ScInfeR annotates cells in three steps: building a similarity matrix, assigning cluster-level labels based on marker correlations, and refining annotations at the single-cell level using neighbourhood-weighted expression.
Figure 2
Figure 2
Quantitative assessment of ScInfeR on Tabula Sapiens lungs scRNA-seq dataset: (a) Comparison of ScInfeR predicted cell types with the ground truth annotations, visualized on the UMAP projection of the lungs scRNA-seq dataset. ScInfeR (M) and ScInfeR (R) represent the marker-based and reference-based performances, respectively. The F1 score (0.94) was calculated by comparing the tool’s predicted annotations with the ground truth annotations; (b,c) bar plot showing the F1 and Adjusted Rand Index (ARI) scores of marker-based and reference-based tools on the same dataset; (d) performance of tools (ScInfeR and Garnett) allowing subtype identification, considering only T cells and endothelial cells, as they have subtypes; (e) run time comparison of all tools on the same dataset.
Figure 3
Figure 3
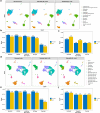
Quantitative assessment of ScInfeR on Tabula Sapiens liver and pancreas scRNA-seq datasets: (a) Comparison of ScInfeR predicted cell types and ground truth annotations, visualized on the UMAP projection of the liver scRNA-seq dataset. ScInfeR (M) and ScInfeR (R) represent the marker-based and reference-based performances, respectively. The F1 score (0.88 and 0.67) was calculated by comparing the tool’s predicted annotations with the ground truth annotations; (b,c) bar plots showing the F1 and Adjusted Rand Index (ARI) scores of marker-based and reference-based tools on the liver scRNA-seq dataset; (d) comparison of ScInfeR predicted cell types and ground truth annotations, visualized on the UMAP projection of the pancreas scRNA-seq dataset; (e,f) bar plot showing the F1 and ARI scores of marker-based and reference-based tools on the pancreas scRNA-seq dataset.
Figure 4
Figure 4
Performance assessment of ScInfeR on scATAC-seq datasets: (a) UMAP plot of cell type inference predicted by reference-based tools that use scATAC-seq data as reference. The scores represent the F1 score obtained by comparing ground truth with the predicted cell types. (b) Bar plot of F1 and ROC scores obtained by comparing the ground truth annotations with the tool’s predicted annotations that use scATAC-seq data as a reference. (c) Cell type inference predicted by reference-based tools that use scRNA-seq data as a reference. (d) Bar plot of F1 and ROC scores obtained by comparing the ground truth annotations with the tool’s predicted annotations that use scRNA-seq data as a reference.
Figure 5
Figure 5
Performance assessment of ScInfeR on spatial transcriptomics datasets: (a) spatial distribution of major cell types predicted by reference-based tools in the STARmap cortex spatial dataset. The scores represent the F1 score obtained by comparing the ground truth with the predicted annotations. X and Y axis represent the coordinates of the spatial data; (b) spatial distribution of major cell types predicted by reference-based tools in the SeqFISH embryo dataset; (c) spatial distribution of major cell types predicted by marker-based tools in the human dorsal prefrontal cortex dataset.
Figure 6
Figure 6
Performance assessment of ScInfeR in scRNA-seq datasets with substantial batch effects: (a) UMAP plot of the integrated pancreas dataset after the batch effect correction; legend represents the techniques used to sequence the cells; (b) UMAP plot of ground truth annotations and ScInfeR predicted annotations on integrated pancreas scRNA-seq dataset. The scores represent the F1 score obtained by comparing the ground truth with the predicted annotations. (c) UMAP plot of the integrated pancreas dataset after the batch effect correction; legends represent the name of study from the dataset retrieved; (d) UMAP plot of ground truth annotation and ScInfeR predicted annotation on integrated PBMC scRNA-seq dataset.

References

    1. Aldridge S, Teichmann SA. Single cell transcriptomics comes of age. Nat Commun 2020;11:4307. 10.1038/s41467-020-18158-5 - DOI - PMC - PubMed
    1. Li X, Wang CY. From bulk, single-cell to spatial RNA sequencing. Int J Oral Sci 2021;13:36. 10.1038/s41368-021-00146-0 - DOI - PMC - PubMed
    1. Chen H, Lareau C, Andreani T. et al. Assessment of computational methods for the analysis of single-cell ATAC-seq data. Genome Biol 2019;20:1–25. 10.1186/s13059-019-1854-5 - DOI - PMC - PubMed
    1. Rao A, Barkley D, França GS. et al. Exploring tissue architecture using spatial transcriptomics. Nature. 2021;596:211–20. 10.1038/s41586-021-03634-9 - DOI - PMC - PubMed
    1. Saliba AE, Westermann AJ, Gorski SA. et al. Single-cell RNA-seq: advances and future challenges. Nucleic Acids Res 2014;42:8845–60. 10.1093/nar/gku555 - DOI - PMC - PubMed

MeSH terms