. 2025 Dec;20(1):2506625.
doi: 10.1080/15592294.2025.2506625. Epub 2025 Jun 5.

Transcriptional signature of cardiac myocyte recovery in mice and human reveals persistent upregulation of epigenetic factors

Affiliations

Transcriptional signature of cardiac myocyte recovery in mice and human reveals persistent upregulation of epigenetic factors

Rebekka Roth et al. Epigenetics. 2025 Dec.

Abstract

Fibrosis, cardiac remodelling, and inflammation are hallmarks of heart failure. To date, there is no available pharmacological cure for heart failure, but mechanical unloading by implantation of a left ventricular assist device (LVAD) can lead to improved cardiac function in a subset of patients. This study aimed to identify the transcriptional response of left ventricular (LV) cardiac myocytes to mechanical unloading in a mouse model of reversible LV pressure overload and in failing human hearts after LVAD implantation. We found that partial recovery of ventricular dysfunction, LV hypertrophy, and gene expression programmes occurred in mice under reversible transverse aortic constriction (rTAC). Gene expression analysis in cardiac myocytes identified a lasting repression of mitochondrial gene expression resulting in compromised fatty acid oxidation in the mouse model of reversible pressure overload and in human LV samples after LVAD therapy and a persistent upregulation of epigenetic and transcriptional regulators. These findings underpin that recovery from heart failure involves complex gene regulatory networks and that mitochondrial dysfunction remains a challenge even after mechanical unloading. Further studies are needed to investigate the functional role of these factors in reverse remodelling and recovery of failing hearts.

Keywords: Heart failure; epigenetics; mechanical unloading; mitochondria; reverse remodeling; transcriptome.


Conflict of interest statement

T.A.M. is a co-founder of Myracle Therapeutics, is on the SABs of Eikonizo Therapeutics and Revier Therapeutics, received funding from Italfarmaco for an unrelated project, and has a subcontract from Eikonizo Therapeutics for an SBIR grant from the National Institutes of Health (HL154959).

Figures
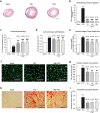
Figure 1.
Figure 1.
Cardiac morphology and function after transverse aortic constriction (TAC) and reverse TAC (rTAC). (a) Representative hematoxylin and eosin stained cardiac cross sections (scale bar, 2 mm). bd, Quantification of (b) Transstenotic pressure gradient (c) Fractional shortening, (d) LV wall thickness after TAC and for indicated time points of rTAC, respectively (sham: n = 5, TAC: n = 6, 7d: n = 7, 14d: n = 5, 28d: n = 5, oneway ANOVA with Bonferroni correction). (e) Ventricle weight/body weight ratios after TAC and for different time points of rTAC (sham: n = 10, TAC: n = 14, 7d: n = 11, 14d: n = 9, 28d: n = 14, oneway ANOVA with Bonferroni correction). (f) Wheat germ agglutinin (WGA) staining of LV cross sections in sham, TAC, and 28 days after rTAC (28d rTAC; scale bar, 50 µm). (g) Quantification of cardiac myocyte cell size in mice after TAC and different time points of rTAC (sham: n = 4, TAC: n = 5, 7d: n = 5, 14d: n = 5, 28d: n = 6, oneway ANOVA with Bonferroni correction). (h) Ventricular fibrosis identified by Sirius red staining in sham, TAC, and 28d rTAC (scale bar, 100 µm). (i) Quantification of interstitial myocardial fibrosis (sham: n = 4, TAC: n = 5, 7d: n = 5, 14d: n = 4, 28d: n = 5, oneway ANOVA with Bonferroni correction). *p < 0.05, **p < 0.01, ***p < 0.001 as compared to sham; ## p < 0.01, ### p < 0.001 as compared to TAC. Numbers above the bars indicate percentage of recovery.
Figure 2.
Figure 2.
Cardiac function and physiology in isolated working hearts after TAC and rTAC. a, Cardiac power was calculated as (cardiac output * mmHg afterload)/dry heart weight (sham: n = 5, TAC: n = 5, 28d rTAC: n = 8, one-way ANOVA with Bonferroni correction). (b) Cardiac output was measured as sum of aortic and coronary flow (sham: n = 5, TAC: n = 5, 28d rTAC: n = 8, one-way ANOVA with Bonferroni correction). (c) Aortic developed pressure (ADevP) was calculated as difference between systolic and diastolic pressure (sham: n = 5, TAC: n = 5, 28d rTAC: n = 8, one-way ANOVA with Bonferroni correction). (d) Heart rate is shown in bpm (beats per minute). (e) Dry heart weight of sham, TAC, and rTAC hearts (sham: n = 5, TAC: n = 5, 28d rTAC: n = 8, one-way ANOVA with Bonferroni correction). (f) Palmitate oxidation as measured by release of 3H2O from hearts perfused with radioactively labeled palmitate (sham: n = 5, TAC: n = 5, 28d rTAC: n = 8, one-way ANOVA with Bonferroni correction). **p < 0.01, ***p < 0.001 as compared to sham; # p < 0.05, ## p < 0.01 ### p < 0.001 as compared to TAC.
Figure 3.
Figure 3.
Transcriptome analysis in isolated cardiac myocytes. (a) Workflow for the isolation of cardiac myocytes (CM) for RNAseq analysis from sham, TAC, and rTAC hearts (sham: n = 3, TAC: n = 3, rTAC: n = 3). (b) Sorting strategy for purification of cardiac myocytes. CM were identified by a high forward scattered light (FSC) and side scattered light (SSC) signal. Discrimination of viable and dead CM was achieved by DRAQ7TM (red population). (c) Bar indicates the number of up (red; q < 0.05, fold change (FC) ≥1.3), or downregulated (blue; q < 0.05, FC ≤ 0.77) mRNAs after TAC compared to sham. Pie charts depict enriched GO terms for up or downregulated RNAs (red and blue respectively). (d) Bar shows number of genes that were upregulated after rTAC (upper red part), genes that were upregulated after TAC and rTAC (lower red part), and genes that were regulated in TAC but were not regulated after rTAC (white) as compared to sham. Enriched GO terms for upregulated (red) and recovered (gray) genes are shown as pie charts. (e) Bar depicts numbers of genes that were downregulated after rTAC (lower blue part), genes that were downregulated after TAC and rTAC (upper blue part), and genes that were downregulated after TAC and were not regulated after rTAC (white) as compared to sham. Pie charts show enriched GO terms for downregulated (blue) and recovered (gray) genes. (f, g) Exemplary IGV traces of genes mentioned in d and e, respectively. Upper panel depicts genes that were up or downregulated after TAC and did not recover after rTAC and lower panel depicts genes that were dysregulated after TAC and recovered after rTAC. (h) Overlap of genes regulated after rTAC (d, e) and associated with the mitochondrion (according to MitoCarta2.0 [23]). Bar chart (right hand side) represents the percentage of overlap. Number of genes that overlap is shown within the bars. (i) Heat map showing the expression changes after TAC and rTAC for the 104 genes shown in h. RPKM: reads per kilobase per million mapped reads, FPKM: fragments per kilobase per million mapped reads, Acad9: acylCoenzyme a dehydrogenase family member 9, Hdac11: histone deacetylase 11, Myh14: myosin heavy chain 14, Tnfrsf12a: tumor necrosis factor receptor superfamily member 12a. Section sizes of the pie charts represent percentage of genes found per term. Significance of terms is indicated by color intensity, highest intensity represents smallest p-value.
Figure 4.
Figure 4.
Shared transcriptional patterns in mouse and human after rTAC and LVAD. (a) Heat map showing genes that were up- (group 1) or downregulated (group 2) after rTAC as compared to sham (RNA-seq). Comparison with human nuclear RNA-seq data shows concordant regulation in cardiac myocyte nuclei obtained from human heart samples with LVAD. Expression changes for cardiac myocytes from TAC and DCM heart tissue are also shown (sham: n = 3, TAC: n = 3, rTAC: n = 3, NF n = 6, DCM: n = 6, LVAD: n = 6). (b) Pie charts represent enriched GO terms for genes that were concordantly up- or downregulated in mouse and human (red and blue, respectively). (c, d_ Bar charts depicting up (c) or downregulation of gene expression for exemplary genes shown in a (DESeq2, *q < 0.05, **q < 0.01, ***q < 0.001 compared to sham or NF, respectively). (e) Schematic representation of mitochondria associated genes and genes encoding for chromatin modifying enzymes that are dysregulated after rTAC. Red: upregulated, dark blue: downregulated, white: not regulated. Acat1: acetyl-Coenzyme a acetyltransferase 1, Brd4: bromodomain containing 4, Crls1: cardiolipin synthase 1, Cs: citrate synthase, Hdac4: histone deacetylase 4, Lactb: lactamase beta, Ncor2: nuclear receptor corepressor 2, Smarca1: SWI/SNF related, matrix associated, actin dependent regulator of chromatin, subfamily a, member 1.

References

    1. McDonagh TA, Metra M, Adamo M, et al. ESC guidelines for the diagnosis and treatment of acute and chronic heart failure. Eur Heart J. 2021;42(36):3599–14. doi: 10.1093/eurheartj/ehab368 - DOI - PubMed
    1. Miller L, Birks E, Guglin M, et al. Use of ventricular assist devices and heart transplantation for advanced heart failure. Circ Res. 2019;124(11):1658–1678. doi: 10.1161/CIRCRESAHA.119.313574 - DOI - PubMed
    1. Hamad EA, Byku M, Larson SB, et al. LVAD therapy as a catalyst to heart failure remission and myocardial recovery. Clin Cardiol. 2023;46(10):1154–1162. doi: 10.1002/clc.24094 - DOI - PMC - PubMed
    1. Burkhoff D, Topkara VK, Sayer G, et al. Reverse remodeling with left ventricular assist devices. Circ Res. 2021;128(10):1594–1612. doi: 10.1161/CIRCRESAHA.121.318160 - DOI - PMC - PubMed
    1. Tatman PD, Kao DP, Chatfield KC, et al. An extensive β1-adrenergic receptor gene signaling network regulates molecular remodeling in dilated cardiomyopathies. JCI Insight. 2023;8(16). doi: 10.1172/jci.insight.169720 - DOI - PMC - PubMed