. 2025 Jun 5;20(6):e0312221.
doi: 10.1371/journal.pone.0312221. eCollection 2025.

TERT translocation as a Novel condition in Intrauterine Growth Restriction rats with early catch-up growth

Affiliations

TERT translocation as a Novel condition in Intrauterine Growth Restriction rats with early catch-up growth

Guo-Qian He et al. PLoS One. .

Abstract

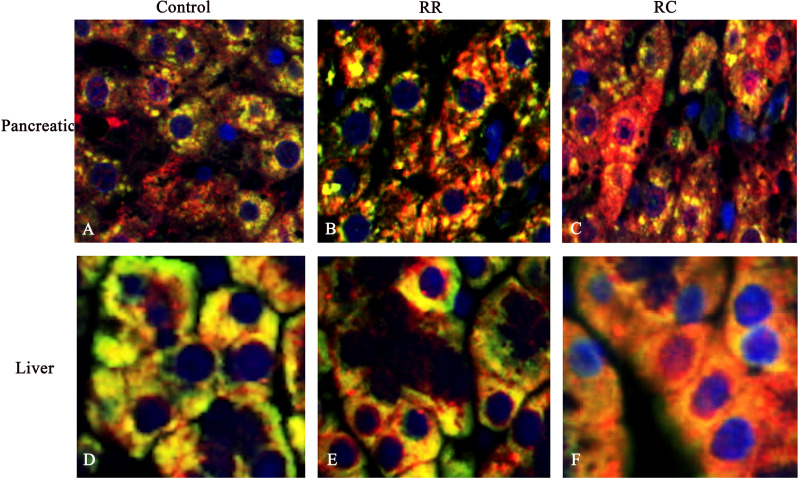
Infants born with intrauterine growth restriction (IUGR) followed by postnatal rapid catch-up growth are prone to develop metabolic diseases later in life. However, its effects and underlying molecular mechanisms remain unclear. Male offspring from mothers fed a low-protein diet (maternal diet, 8% protein) were randomly assigned to one of the following groups: normal diet (RC group) and low-protein diet (RR group). Offspring were fed a normal-protein diet (maternal diet, 20% protein, control group). In our study, at birth, approximately 93.33% of the offspring fats from mothers fed a low-protein diet were born with IUGR. Following weaning, all IUGR groups showed catch-up growth. The RC groups showed accelerated and early postnatal catch-up growth and regained the same weight as the controls from 3 to 9 months. At 9 months of age, the RC group animals had shorter telomere length (TL) than the Control and RR groups and also showed higher oxidative stress levels and lipid levels. Furthermore, compared to the control group, there was increased mitochondrial translocation of telomerase reverse transcriptase (TERT) under conditions of elevated oxidative stress in the RC group. There was no significant difference in mtDNA content between the RC and control groups. Moreover, at 9 months of age, only in the RC group were liver and pancreas Sirt3 expression levels higher than in the Control and RR groups. These data indicate that IUGR with early and rapid catch-up growth is exposed to chronic oxidative stress and subsequently affects TL and TERT translocations. Chronic oxidative stress may promote the translocation of TERT from the nucleus to mitochondria and protect tissues from oxidative stress damage.


Conflict of interest statement

The authors have declared that no competing interests exist.

Figures

Fig 1
Fig 1. RC group showed an early catch-up growth.
A. Body weights in different groups of rats during lactation (0-3 weeks). The RC group showed steeper growth slopes compared with the control group, whereas the RR group exhibited gentler growth than the control group. B. Body weights of different groups of rats from birth to 36 weeks. The RC group exhibited steeper growth slopes than did the control group. C. Body weight gain velocity in different groups of rats during lactation and after weaning. The RC group showed significant body weight gain during lactation compared to the RR group. D.SDSweight in different groups of rats during lactation and after weaning. The data on △SDSweight was higher in RC group during lactation compared with the Control group and RR group.Control, non-IUGR rats receiving a normal diet during lactation and after weaning; RC, IUGR rats cross-fostering to a normal nutrition dam during lactation and receiving a normal diet after weaning;RR, IUGR rats receiving a low-protein diet during lactation and a normal diet after weaning;IUGR, intrauterine growth retardation.△SDSweight,the weight SD Score.*p < 0.05 vs Control;#p < 0.05 vs RR;**p < 0.01 vs Control.##p < 0.01 vs RR.
Fig 2
Fig 2. BMI and △SDSBMI of rats significantly increased in RC group.
A. BMI in different groups of rats after weaning: Compared to the RR group, the BMI of the RC group was significantly increased.B. SDSBMI in different groups of rats during lactation and after weaning. During lactation, the RC group showed significant △SDSBMI during lactation compared with the RR group.Control, non-IUGR rats receiving a normal diet during lactation and after weaning; RC, IUGR rats cross-fostering to a normal nutrition dam during lactation and receiving a normal diet after weaning;RR, IUGR rats receiving a low-protein diet during lactation and a normal diet after weaning;IUGR, intrauterine growth retardation.△SDSBMI, the BMI SD Score.*p < 0.05 vs Control;#p < 0.05 vs RR;**p < 0.01 vs Control.##p < 0.01 vs RR.
Fig 3
Fig 3. 8-iso-PGF2α, MDA levels and Serum lipid levels increased in RC group.
8-iso-PGF2α (A) and MDA (B) levels in the adipose, pancreatic, and liver tissues of different groups of rats. 8-iso-PGF2α, a stable and specific marker for oxidative stress, was significantly increased in the RC group compared to the control and RR groups. C.Serum TC, TG, LDL-C, and HDL-C levels in different groups of rats at 9 months of age after birth.Control, non-IUGR rats receiving a normal diet during lactation and after weaning; RC, IUGR rats cross-fostering to a normal nutrition dam during lactation and receiving a normal diet after weaning; RR, IUGR rats receiving a low-protein diet during lactation and a normal diet after weaning; IUGR, intrauterine growth retardation; TC, total cholesterol; TG, triglyceride; LDL-C, low-density lipoprotein C; HDL-C, high-density lipoprotein C.*P < 0.05 vs Control; #P < 0.05 vs RR.
Fig 4
Fig 4. Expressions of Sirtuin3 obviously increased in RC group.
A. IHC staining of sirtuin3 (yellow brown) in the cytoplasm of rat pancreatic cells. B. IHC staining of sirtuin3 (yellow brown) in the cytoplasm of rat liver cells.C. The quantification of the expression of Sirtuin3 in rats pancreas and liver.IHC, immunohistochemical staining; Control, non-IUGR rats receiving a normal diet during lactation and after weaning; RC, IUGR rats cross-fostering to a normal nutrition dam during lactation and receiving a normal diet after weaning;RR, IUGR rats receiving a low-protein diet during lactation and a normal diet after weaning;IUGR, intrauterine growth retardation. Scale bars, 40 µm. *P < 0.05 vs Control; #P < 0.05 vs RR.
Fig 5
Fig 5. TERT shifted from nucleus to mitochondria in the pancreatic and liver cells of RC group.
Immunofluorescence images with TERT (red), nuclear stain (DAPI, blue), and mitochondrial stain (green) in rat pancreas and liver cells. Note that in control offspring, TERT was detected in the cytoplasm and nucleus of rat pancreas (A) and liver cells (D). In RR offspring, TERT was detected in the mitochondria of rat pancreatic cells (B) and liver cells (E). In RC offspring, TERT was obviously shifted from the nucleus to the mitochondria in pancreatic (C) and liver tissues (F). Control, non-IUGR rats receiving a normal diet during lactation and after weaning; RC, IUGR rats cross-fostering to a normal nutrition dam during lactation and receiving a normal diet after weaning;RR, IUGR rats receiving a low-protein diet during lactation and a normal diet after weaning;IUGR, intrauterine growth retardation.Scale bars, 40 µm.
Fig 6
Fig 6. Protein levels of TERT in mitochondrial and nuclear increased in RC group.
Note that in the pancreatic (A) and liver tissues (B) of RC offspring, TERT mitochondrial/COX-IV protein levels showed a significant increase compared to controls. C.The Quantification of the expression in rat pancreas and liver.D. Relative mtDNA content. The relative copy number of mtDNA was calculated by evaluating the ΔCt (2-ΔCt) of the reference gene. Data revealed that no significant differences in mtDNA content between RC group and Control group.Control, non-IUGR rats receiving a normal diet during lactation and after weaning; RC, IUGR rats cross-fostering to a normal nutrition dam during lactation and receiving a normal diet after weaning;RR, IUGR rats receiving a low-protein diet during lactation and a normal diet after weaning;IUGR, intrauterine growth retardation.*P < 0.05 vs Control.

Similar articles

Cited by

References

    1. Dai Y, Zhao D, Chen CK, Yap CH. Echocardiographic assessment of fetal cardiac function in the uterine artery ligation rat model of IUGR. Pediatr Res. 2021;90(4):801–8. doi: 10.1038/s41390-020-01356-8 - DOI - PMC - PubMed
    1. Shimada H, Powell TL, Jansson T. Regulation of placental amino acid transport in health and disease. Acta Physiol (Oxf). 2024;240(7):e14157. doi: 10.1111/apha.14157 - DOI - PMC - PubMed
    1. Naemi M, Farahani Z, Norooznezhad AH, Khodarahmi R, Hantoushzadeh S, Ahangari R, et al.. Possible potentials of curcumin for pregnancies complicated by intra-uterine growth restriction: role of inflammation, angiogenesis, and oxidative stress. Heliyon. 2021;7(9):e08034. doi: 10.1016/j.heliyon.2021.e08034 - DOI - PMC - PubMed
    1. Tasta O, Swiader A, Grazide M-H, Rouahi M, Parant O, Vayssière C, et al.. A role for 4-hydroxy-2-nonenal in premature placental senescence in preeclampsia and intrauterine growth restriction. Free Radic Biol Med. 2021;164:303–14. doi: 10.1016/j.freeradbiomed.2021.01.002 - DOI - PubMed
    1. Jansson N, Pettersson J, Haafiz A, Ericsson A, Palmberg I, Tranberg M, et al.. Down-regulation of placental transport of amino acids precedes the development of intrauterine growth restriction in rats fed a low protein diet. J Physiol. 2006;576(Pt 3):935–46. doi: 10.1113/jphysiol.2006.116509 - DOI - PMC - PubMed

LinkOut - more resources