. 2025 May 30;198(2):kiaf225.
doi: 10.1093/plphys/kiaf225.

Mutations in the floral regulator gene HUA2 restore flowering to the Arabidopsis trehalose 6-phosphate synthase1 (tps1) mutant

Affiliations

Mutations in the floral regulator gene HUA2 restore flowering to the Arabidopsis trehalose 6-phosphate synthase1 (tps1) mutant

Liping Zeng et al. Plant Physiol. .

Abstract

Plant growth and development are regulated by many factors, including carbohydrate availability and signaling. Trehalose 6-phosphate (T6P), which is synthesized by TREHALOSE-6-PHOSPHATE SYNTHASE 1 (TPS1), is positively associated with and functions as a signal that informs the cell about the carbohydrate status. Mutations in TPS1 negatively affect the growth and development of Arabidopsis (Arabidopsis thaliana), and complete loss-of-function alleles are embryo-lethal, which can be overcome using inducible expression of TPS1 (GVG::TPS1) during embryogenesis. Using ethyl methane sulfonate mutagenesis in combination with genome re-sequencing, we have identified several alleles in the floral regulator gene HUA2 that restore flowering in tps1-2 GVG::TPS1. Genetic analyses using an HUA2 T-DNA insertion allele, hua2-4, confirmed this finding. RNA-seq analyses demonstrated that hua2-4 has widespread effects on the tps1-2 GVG::TPS1 transcriptome, including key genes and pathways involved in regulating flowering. Higher order mutants combining tps1-2 GVG::TPS1 and hua2-4 with alleles in the key flowering time regulators FLOWERING LOCUS T (FT), SUPPRESSOR OF OVEREXPRESSION OF CONSTANS 1 (SOC1), and FLOWERING LOCUS C (FLC) were constructed to analyze the role of HUA2 during floral transition in tps1-2 in more detail. Our findings demonstrate that loss of HUA2 can restore flowering in tps1-2 GVG::TPS1, in part through activation of FT, with contributions from the upstream regulators SOC1 and FLC. Interestingly, we found that mutation of FLC is sufficient to induce flowering in tps1-2 GVG::TPS1. Furthermore, we observed that mutations in HUA2 modulate carbohydrate signaling and that this regulation might contribute to flowering in hua2-4 tps1-2 GVG::TPS1.


Conflict of interest statement

Conflict of interest statement. None declared.

Figures
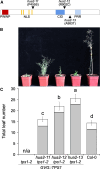
Figure 1.
Figure 1.
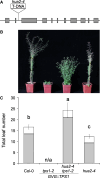
EMS-induced mutations in HUA2 induce flowering in tps1-2 GVG::TPS1 background. A) Schematic drawing of HUA2 indicating the position and the amino acid changes caused by the ethyl methanesulfonate (EMS)-induced mutations hua2-11 (P455S), hua2-12 (R902C), and hua2-13 (A983T). PWWP: PWWP protein domain; NLS: nuclear localization signal; CID: RNA polymerase II (RNAPII) C-terminal domain (CTD) interaction domain; PRR: proline-rich region. B) Phenotype of 9-wk-old tps1-2 GVG::TPS1, hua2-11 tps1-2 GVG::TPS1, hua2-12 tps1-2 GVG::TPS1, and hua2-13 tps1-2 GVG::TPS1 and wild-type Col-0 plants grown in LD with a photoperiod of 16 h light at 22 °C and 8 h darkness at 20 °C. GVG::TPS1 designates a dexamethasone-inducible TPS1 transgene present in the genotype. C) Flowering time of genotypes is given as total leaf number (rosette leaves: gray; cauline leaves: white) determined after bolting. Error bars represent the standard deviation of the total leaf number based on 20 individuals per genotype (Supplementary Table S4). ANOVA Tukey's multiple comparisons test was applied, and letters represent the statistical differences among genotypes (P  <  0.001).
Figure 2.
Figure 2.
A T-DNA insertion in HUA2 partially rescues the flowering time phenotype of tps1-2 GVG::TPS1. A) Schematic drawing of the HUA2 locus indicating the position of the T-DNA insertion (SALK_032281C) in the 2nd intron in hua2-4. Gray boxes indicated exons. B, C) Phenotypic analysis (B) and flowering time (C) of 9-wk-old wild-type Col-0, tps1-2 GVG::TPS1, hua2-4 tps1-2 GVG::TPS1 and hua2-4 plants grown in LD with a photoperiod of 16 h light at 22 °C and 8 h darkness at 20 °C. GVG::TPS1 designates a dexamethasone-inducible TPS1 transgene present in the genotype. Flowering time was scored as total leaf number (rosette leaves: gray; cauline leaves: white) after bolting. Error bars represent the standard deviation of the total leaf number based on 20 individuals per genotype (Supplementary Table S4). ANOVA Tukey's multiple comparisons test was applied, and letters represent the statistical differences among genotypes (P  <  0.001).
Figure 3.
Figure 3.
Characterization of the hua2-4 tps1-2 GVG::TPS1 transcriptome. A) 4-way Venn diagram of genes that are differentially expressed in tps1-2 GVG::TPS1 in response to dexamethasone (DEX) treatment and/or differentially expressed in hua2-4 tps1-2 GVG::TPS1 when compared with tps1-2 GVG::TPS1. GVG::TPS1 designates a dexamethasone-inducible TPS1 transgene present in the genotype. Expression estimates and lists of DEGs were calculated based on 3 biological RNA-seq replicates per genotype. B) GO analysis of 392 genes downregulated in tps1-2 GVG::TPS1 in response to dexamethasone treatment and in hua2-4 tps1-2 GVG::TPS1. C) GO analysis of 237 genes upregulated in tps1-2 GVG::TPS1 in response to dexamethasone treatment and in hua2-4 tps1-2 GVG::TPS1.  D) Relative expression of AGAMOUS-LIKE 24 (AGL24) and SUPPRESSOR OF OVEREXPRESSION OF CONSTANS 1 (SOC1) in tps1-2 GVG::TPS1 (white), tps1-2 GVG::TPS1 treated with dexamethasone (black), and hua2-4 tps1-2 GVG::TPS1 (gray). AGL24 and SOC1 are significantly differentially expressed. Error bars indicate the standard deviation based on 3 biological replicates. ANOVA Tukey's multiple comparisons test was applied, and letters represent the statistical differences among genotypes (P  <  0.001). E) 4-way Venn diagram of genes known sucrose non-fermenting 1 (SNF1)-related protein kinases (SnRK1) and target of rapamycin (TOR) target genes that are differentially expressed in tps1-2 GVG::TPS1 in response to dexamethasone treatment and/or differentially expressed in hua2-4 tps1-2 GVG::TPS1 when compared with tps1-2 GVG::TPS1. F) GO analysis of 700 SnRK1 and TOR target genes differentially expressed in tps1-2 GVG::TPS1 in response to dexamethasone application and loss of HUA2 function.
Figure 4.
Figure 4.
Genetic interactions between tps1-2, hua2-4, and floral regulators SOC1, FT, and FLC. A, B) Phenotypes (A) and flowering time (B) of Col-0, hua2-4, tps1-2 GVG::TPS1, and soc1-2 mutant combinations. D, E) Phenotypes (D) and flowering time (E) of Col-0, hua2-4, tps1-2 GVG::TPS1, and ft-10 mutant combinations. G, H) Phenotypes (G) and flowering time (H) of Col-0, hua2-4, tps1-2 GVG::TPS1, and flc-3 mutant combinations. Flowering time (B, E, H) was scored as total leaf number (rosette leaves: gray; cauline leaves: white) after bolting. GVG::TPS1 designates a dexamethasone-inducible TPS1 transgene present in the genotype. Error bars represent the standard deviation of the total leaf number based on 20 individuals per genotype, except ft-10 for which 10 individuals were phenotyped (Supplementary Table S4). ANOVA Tukey's multiple comparisons test was applied, and letters represent the statistical differences among genotypes (P  <  0.001). C, F, I) Relative expression of SUPPRESSOR OF OVEREXPRESSION OF CONSTANS 1 (SOC1) (C), FLOWERING LOCUS T (FT) (F), and FLOWERING LOCUS C (FLC) (I) in tps1-2 GVG::TPS1 and hua2-4 tps1-2 GVG::TPS1. Gene expression was determined by RT-qPCR at the end of the LD (zeitgeber [ZT] 16). Error bars represent the standard deviation based on 3 biological replicates with 3 technical replicates each.
Figure 5.
Figure 5.
Loss of FLC rescues the non-flowering phenotype of tps1-2 GVG::TPS1. A) Variance stabilizing transformation (VST) expression estimates for MCM1, AGAMOUS, DEFICIENS, and SRF (MADS)-box floral repressors in 18-d-old plants. RNA-seq expression data retrieved from Zacharaki et al. (2022). Columns indicate mean VST expression estimates as implemented in DEseq2 calculated from 3 individual biological replicates per genotype. Col-0: black; tps1-2 GVG::TPS1: gray. Circles indicate expression estimates for individual biological replicates. Asterisks indicate differential gene expression with a statistical significance of Padj  <  0.01 based on 3 biological replicates per genotype. B, C) Phenotypes (B) and total leaf number (C) of Col-0, tps1-2 GVG::TPS1, flc-3, and flc-3 tps1-2 GVG::TPS1 double mutant. GVG::TPS1 designates a dexamethasone-inducible TPS1 transgene present in the genotype. Flowering time was scored as total leaf number (rosette [gray] and cauline leaves [white]) after bolting. Error bars represent the standard deviation of the total leaf number based on 20 individuals per genotype (Supplementary Table S4). ANOVA Tukey's multiple comparisons test was applied, and letters represent the statistical differences among genotypes (P  <  0.001). D) Expression of TPS1 in col-0, tps1-2 GVG::TPS1, and flc-3 tps1-2 GVG::TPS1, in 28-d-old LD-grown plants. Samples were taken at zeitgeber (ZT) 4. Error bars represent the standard deviation based on 3 biological replicates with 3 technical replicates each. ANOVA Tukey's multiple comparisons test was applied, and letters represent the statistical differences among genotypes (P  <  0.001). LD, long-day.
Figure 6.
Figure 6.
Vernalization induces flowering in tps1-2 GVG::TPS1. A) Experimental setup. Col-0 and tps1-2 GVG::TPS1 plants were grown on soil under short days (SD) at 22 °C for 24 d, before being shifted to 4 °C for 8 wk for vernalization, after which plants were returned to 22 °C till flowering. GVG::TPS1 designates a dexamethasone-inducible TPS1 transgene present in the genotype. Samples were taken weekly for RT-qPCR analyses as indicated (arrows), starting 1 wk before the shift to 4 °C. B, C) RT-qPCR expression of FLOWERING LOCUS C (FLC) (B) and SERINE/THREONINE PROTEIN PHOSPHATASE (PP2A) (C) in Col-0 and tps1-2 GVG::TPS1. RNA for time points T1 to T7 was extracted from whole plants, while RNA for samples T9, T10, and T11 was isolated from leaves (L). For time point 8, RNA was extracted from both whole plants (T8) and leaves (T8L). Error bars show the standard deviation of 6 biological replicates (n = 6) for each time point. D, E) Flowering time of Col-0 (n = 11) and tps1-2 GVG::TPS1 (n = 22) in days to flower (D) and total leaf number (E). Asterisks indicate statistical significance according to a 2-tailed Student's t-test assuming unequal variance (*: P  <  0.05; *** P  <  0.001).
Figure 7.
Figure 7.
Expression of SnRK1 target genes SEN5 and DIN6 in hua2-4 and hua2-4 tps1-2 GVG::TPS1 double mutant. A, B) Induction of SEN5  (A) and DIN6  (B) in response to extended night is attenuated in hua2-4 single mutant and 3 independent lines of the hua2-4 tps1-2 GVG::TPS1 double mutant. GVG::TPS1 designates a dexamethasone-inducible TPS1 transgene present in the genotype. Plants were grown for 14 d in LD (gray) before being exposed to a single extended night (12 h additional darkness; black). LD, long days. Expression was determined by RT-qPCR using 3 biological replicates with 3 technical repetitions each and normalized to TUBULIN BETA CHAIN 2 (TUB2). Error bars represent the standard deviation. ANOVA Tukey's multiple comparisons test was applied, and letters represent the statistical differences among genotypes (P  <  0.001).

Similar articles

References

    1. 1001 Genomes Consortium . 1,135 genomes reveal the global pattern of polymorphism in Arabidopsis thaliana. Cell. 2016:166(2):481–491. 10.1016/j.cell.2016.05.063. - DOI - PMC - PubMed
    1. Abe M, Kobayashi Y, Yamamoto S, Daimon Y, Yamaguchi A, Ikeda Y, Ichinoki H, Notaguchi M, Goto K, Araki T. FD, a bZIP protein mediating signals from the floral pathway integrator FT at the shoot apex. Science. 2005:309(5737):1052–1056. 10.1126/science.1115983 - DOI - PubMed
    1. Artins A, Caldana C. The metabolic homeostaTOR: the balance of holding on or letting grow. Curr Opin Plant Biol. 2022:66:102196. 10.1016/j.pbi.2022.102196 - DOI - PubMed
    1. Artins A, Martins MCM, Meyer C, Fernie AR, Caldana C. Sensing and regulation of C and N metabolism—novel features and mechanisms of the TOR and SnRK1 signaling pathways. Plant J. 2024:118(5):1268–1280. 10.1111/tpj.16684 - DOI - PubMed
    1. Avidan O, Moraes TA, Mengin V, Feil R, Rolland F, Stitt M, Lunn JE. In vivo protein kinase activity of SnRK1 fluctuates in Arabidopsis rosettes during light-dark cycles. Plant Physiol. 2023:192(1):387–408. 10.1093/plphys/kiad066 - DOI - PMC - PubMed

MeSH terms