. 2025 Jul:117:105795.
doi: 10.1016/j.ebiom.2025.105795. Epub 2025 Jun 4.

Early de novo T cell expansion following SARS-CoV-2 infection predicts favourable clinical and virological outcomes

Collaborators, Affiliations

Early de novo T cell expansion following SARS-CoV-2 infection predicts favourable clinical and virological outcomes

Joe Fenn et al. EBioMedicine. 2025 Jul.

Abstract

Background: De novo T cell expansion to a novel viral infection is assumed to confer protection, but empirical evidence in humans is limited. The SARS-CoV-2 pandemic provided a unique opportunity to investigate de novo T cell-mediated protection in antigen-naïve individuals without the confounding effects of preexisting immune memory.

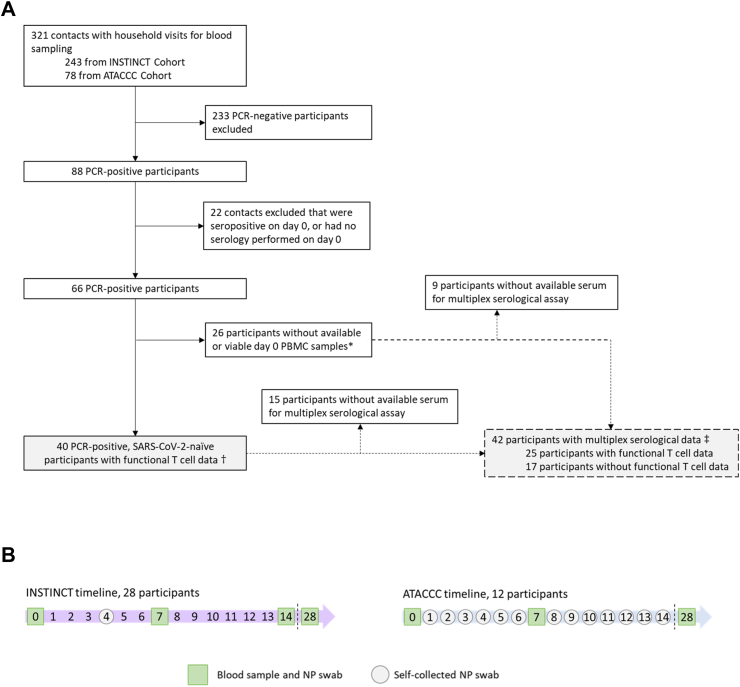
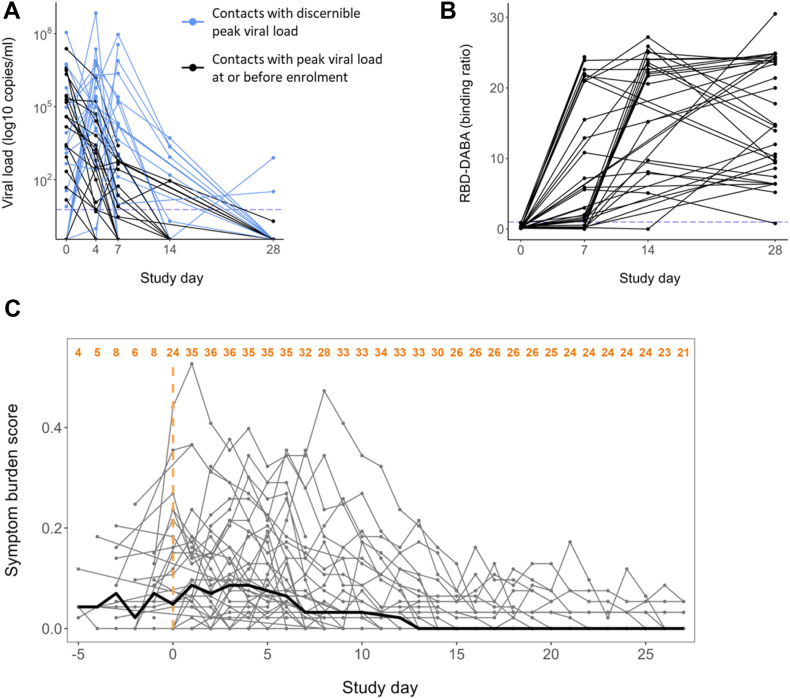
Methods: We leveraged a prospective household contact study to recruit new COVID-19 cases a median of 4 days post-SARS-CoV-2 exposure. We longitudinally enumerated SARS-CoV-2 antigen-specific functional T cell subsets using dual IFN-γ/IL-2 fluorescence-linked immunospot (FLISpot) assays. We then correlated T cell dynamics with detailed clinical and virological outcomes derived from longitudinal measurement of symptom burden and viral load.

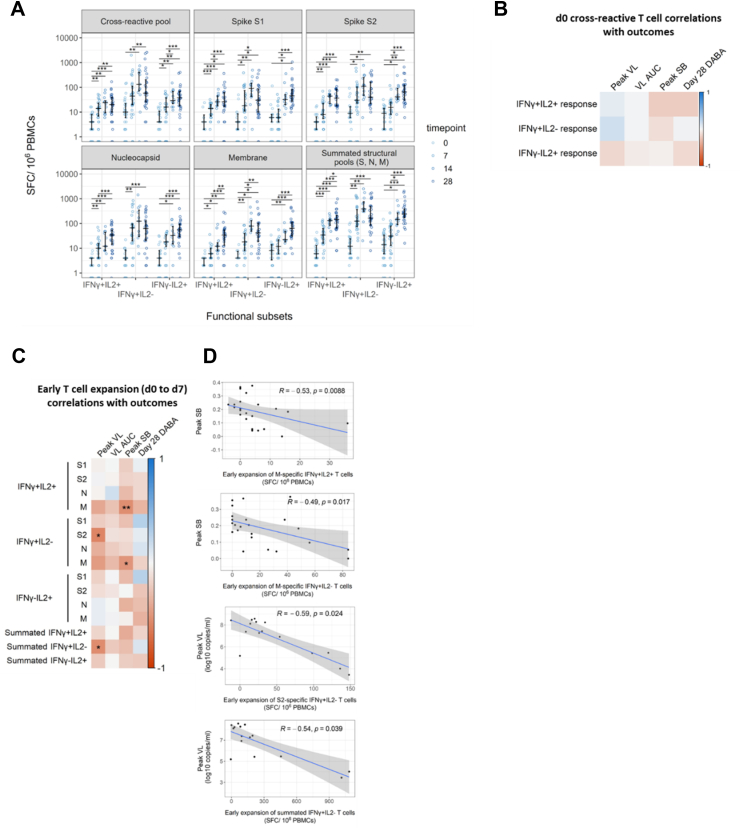
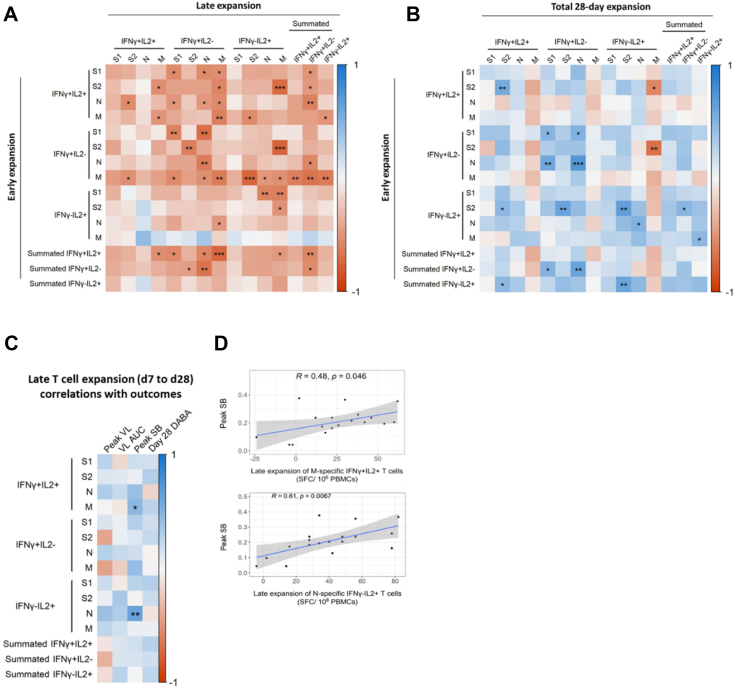
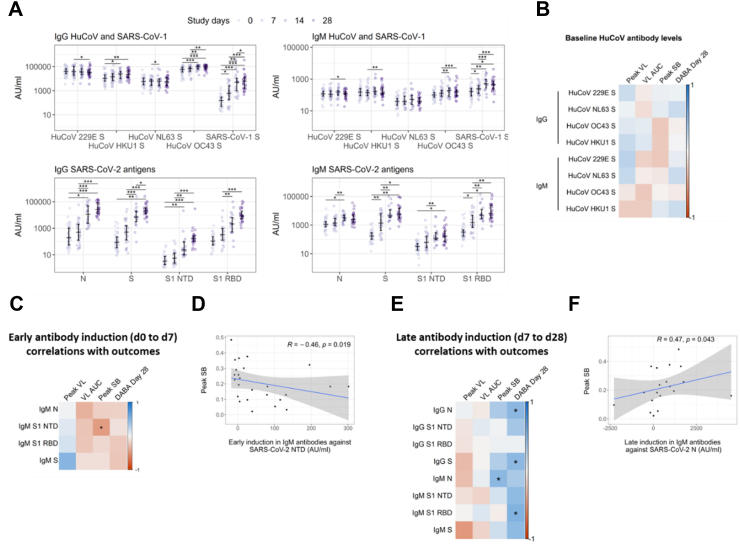
Findings: Early expansion (day 0-7) of SARS-CoV-2-specific IFN-γ-secreting T cells correlated with lower peak viral load and symptom burden. Conversely, late T cell expansion (day 7-28) correlated with higher symptom burden. Neither pre-existing cross-reactive T cells nor early antibody induction correlated with virological outcomes.

Interpretation: These findings provide empiric evidence for early antigen-specific T cell expansion being protective against naturally acquired viral infection in humans.

Funding: This work is supported by the NIHR Health Protection Research Unit in Respiratory Infections, Imperial College London in partnership with the UK Health Security Agency (Grant number: NIHR200927; AL) and the Medical Research Council (Grant number: MR/X004058/1).

Keywords: Correlates of protection; Household contacts; SARS-CoV-2; T cell.


Conflict of interest statement

Declaration of interests The authors declare no competing interests. The INSTINCT study group was funded by NIHR as part of the Health Protection Research Unit in Respiratory Infections (NIHR200927).

Figures

Fig. 1
Fig. 1
Inclusion criteria for contacts included in the analysis (A), and INSTINCT and ATACCC recruitment timelines (B). INSTINCT, Integrated Network for Surveillance, Trials and Investigations into COVID-19 Transmission. ATACCC, Assessment of Transmission and Contagiousness of COVID-19 in Contacts. All household contacts were enrolled a median of 4 days (IQR 3–5) after first exposure to a symptomatic primary case. Definitions: PCR-positivity was defined as any Ct value < 35 (ATACCC) or VL > 5 copies per PCR reaction (INSTINCT) from a nasopharyngeal (NP) swab in the first 14 days post-enrolment. A sample was considered seropositive if DABA binding ratio ≥1. ∗Non-viable PBMC samples refer to samples that had insufficient viable cells after thawing, or that had no response to the positive controls in the FLISpot assay. †Results shown in Fig. 2, Fig. 3, Fig. 4. ‡Results shown in Fig. 5.
Fig. 2
Fig. 2
Characterisation of the study cohort. Forty recently exposed contacts with no evidence of prior SARS-CoV-2 infection or vaccination were followed longitudinally during the full course of their infection. (A) Viral load trajectories of the cohort. Threshold for positivity is shown with a dotted line at 6 copies/RT-PCR reaction. Blue lines indicate the 19 contacts in whom peak viral load (pVL) could be resolved and used as a virological outcome. Black lines indicate 21 contacts in whom pVL occurred at or before enrolment (d0) and hence pVL could not be reliably determined. (B) Serum IgG and IgM anti-RBD antibodies were measured using a hybrid double antigen binding assay (DABA). Threshold for positivity is shown with a dotted line at binding ratio of 1 arbitrary unit (AU). (C) Individual trajectories of the symptom burden score (in grey) and the median score for the whole cohort each day of observation (in bold black) (n = 38, 2 contacts did not complete comprehensive symptom diaries). The number of participants with symptom scores available for each day is shown in orange at the top. The symptoms comprising the symptom burden score and the scoring are detailed in Table S2.
Fig. 3
Fig. 3
Early de novo induction of SARS-CoV-2 specific T cells in recently exposed, PCR-positive contacts correlate with favourable infection outcomes. (A) Early de novo induction of SARS-CoV-2 specific T cells in recently exposed, PCR-positive contacts correlate with favourable infection outcomes. Longitudinal frequencies of cytokine-producing T cells were measured using a FLISpot assay. Spot-forming cells (SFC) per million PBMCs are displayed stratified by peptide pool and functional subset. Comparisons between timepoints were performed using mixed-effect analysis with Holm-Sidak correction for multiple testing. Summated responses for each functional T cell subset are derived from the sum of frequencies of S, M and N pool-specific T cells. Number of replicates at each time point varies due to random loss to follow-up and limited d14 sample collection d0 n = 40, d7 n = 30, d14 n = 12, d28 n = 29. (B) Heatmap depicting Spearman's analysis demonstrating lack of significant correlations between frequencies of cross-reactive peptide-responsive T cells at d0 and peak VL (n = 21), VL AUC (n = 40), peak SB (n = 38) and DABA at d28 (n = 33). (C) Heatmap depicting Spearman's analysis demonstrating significant correlation between early expansion (d0 to d7) of T cells specific for structural protein-derived peptides with peak VL (n = 16), VL AUC (n = 28), peak SB (n = 26) and DABA at d28 (n = 22). (D) Scatter plots depicting significant associations between early expansion of T cell subsets and peak SB or peak VL identified in Fig. 3C. Line of best fit and 95% confidence interval are displayed.
Fig. 4
Fig. 4
Early expansion of antigen-specific T cells predicts magnitude of later expansion. (A) Heatmap depicting Spearman's analysis of correlations between early (d0–d7) and late (d7–d28) T cell expansion. (B) Heatmap depicting Spearman's analysis of correlations between early (d0–d7) and total 28-day (d0–d28) T cell expansion. Summated responses for each functional T cell subset are derived from the sum of frequencies of S, M and N pool-specific T cells. In all plots, statistically significant correlations are indicated by asterisks (∗p ≤ 0.05, ∗∗p ≤ 0.01, ∗∗∗p ≤ 0.001, ∗∗∗∗p ≤ 0.0001). Heatmap colour represents Spearman's R value. Blue indicates a positive correlation whilst red indicates a negative correlation. (C) Heatmap depicting Spearman's analysis demonstrating significant correlation between late expansion (d7 to d28) of T cells specific for structural protein-derived peptides with peak VL (n = 10), VL AUC (n = 20), peak SB (n = 20) and DABA at d28 (n = 20). (D) Scatter plots depicting significant associations between early expansion of T cell subsets and peak SB identified in Fig. 3E. Line of best fit and 95% confidence interval are displayed. In all plots, statistically significant correlations are indicated by asterisks (∗p ≤ 0.05, ∗∗p ≤ 0.01, ∗∗∗p ≤ 0.001, ∗∗∗∗p ≤ 0.0001). Heatmap colour represents Spearman's R value. Blue indicates a positive correlation whilst red indicates a negative correlation.
Fig. 5
Fig. 5
SARS-CoV-2-specific antibody induction in previously SARS-CoV-2-naïve participants during acute infection. (A) Longitudinal antibody titres against SARS-CoV-2 and HuCoV antigens, grouped by isotype, were measured using an MSD V-plex assay. Comparisons between timepoints were performed using mixed-effect analysis with Holm-Sidak correction for multiple testing. (B) Spearman's correlation analysis of antibody titres against HuCoVs at d0 with peak VL (n = 22), VL AUC (n = 42), peak SB (n = 41) and DABA at d28 (n = 28). (C) Spearman's correlation analysis of early antibody induction, defined as the induction between d0 and 7, between all IgM titres and peak VL (n = 12), VL AUC (n = 29), peak SB (n = 29) and DABA at d28 (n = 21). A single outlier with early S1 NTD-specific IgM induction >3 standard deviations above the mean (2190 AU) was excluded in these analyses. (D) Correlation between early induction of anti-S1 NTD IgM and peak SB is shown. Spearman's R and p values are displayed (R and p values with inclusion of outlier are 0.51 and 0.0072 respectivly). (E) Spearman's correlation analysis of late antibody induction, defined as the induction from d7 to 28, between all IgM and IgG titres and peak VL (n = 10), VL AUC (n = 22), peak SB (n = 22) and DABA at d28 (n = 21). A single outlier with early S1 NTD-specific IgM induction >3 standard deviations above the mean (35000 AU) was excluded in these analyses. (F) Correlation between late induction of anti-N IgM and peak SB is shown. (R and p values with inclusion of outlier are 0.48 and 0.032 respectivly). In all plots, statistically significant correlations are indicated by asterisks (∗p ≤ 0.05, ∗∗p ≤ 0.01, ∗∗∗p ≤ 0.001, ∗∗∗∗p ≤ 0.0001). Heatmap colour represents Spearman's R value. Blue indicates a positive correlation whilst red indicates a negative correlation.

Similar articles

  • An ultra-early, transient interferon-associated innate immune response associates with protection from SARS-CoV-2 infection despite exposure.
    Fenn J, Madon K, Conibear E, Derelle R, Nevin S, Kundu R, Hakki S, Tregoning JS, Koycheva A, Derqui N, Tolosa-Wright M, Jonnerby J, Wang L, Baldwin S, Pillay TD, Thwaites RS, Luca C, Varro R, Badhan A, Parker E, Rosadas C, McClure M, Tedder R, Taylor G, Lalvani A; INSTINCT Study Investigators. Fenn J, et al. EBioMedicine. 2025 Jan;111:105475. doi: 10.1016/j.ebiom.2024.105475. Epub 2024 Dec 11. EBioMedicine. 2025. PMID: 39667271 Free PMC article.
  • Antibody tests for identification of current and past infection with SARS-CoV-2.
    Fox T, Geppert J, Dinnes J, Scandrett K, Bigio J, Sulis G, Hettiarachchi D, Mathangasinghe Y, Weeratunga P, Wickramasinghe D, Bergman H, Buckley BS, Probyn K, Sguassero Y, Davenport C, Cunningham J, Dittrich S, Emperador D, Hooft L, Leeflang MM, McInnes MD, Spijker R, Struyf T, Van den Bruel A, Verbakel JY, Takwoingi Y, Taylor-Phillips S, Deeks JJ; Cochrane COVID-19 Diagnostic Test Accuracy Group. Fox T, et al. Cochrane Database Syst Rev. 2022 Nov 17;11(11):CD013652. doi: 10.1002/14651858.CD013652.pub2. Cochrane Database Syst Rev. 2022. PMID: 36394900 Free PMC article.
  • Rapid, point-of-care antigen tests for diagnosis of SARS-CoV-2 infection.
    Dinnes J, Sharma P, Berhane S, van Wyk SS, Nyaaba N, Domen J, Taylor M, Cunningham J, Davenport C, Dittrich S, Emperador D, Hooft L, Leeflang MM, McInnes MD, Spijker R, Verbakel JY, Takwoingi Y, Taylor-Phillips S, Van den Bruel A, Deeks JJ; Cochrane COVID-19 Diagnostic Test Accuracy Group. Dinnes J, et al. Cochrane Database Syst Rev. 2022 Jul 22;7(7):CD013705. doi: 10.1002/14651858.CD013705.pub3. Cochrane Database Syst Rev. 2022. PMID: 35866452 Free PMC article.
  • Detectable SARS-CoV-2 specific immune responses in recovered unvaccinated individuals 250 days post wild type infection.
    Weigl N, Pleimelding C, Gilberg L, Huynh D, Brand I, Bruger J, Frese J, Eser TM, Ahmed MIM, Guggenbuehl-Noller JM, Stirner R, Hoelscher M, Pritsch M, Geldmacher C, Kobold S, Roider J; KoCo19-/ORCHESTRA-study group. Weigl N, et al. PLoS One. 2025 Jun 11;20(6):e0325923. doi: 10.1371/journal.pone.0325923. eCollection 2025. PLoS One. 2025. PMID: 40498720 Free PMC article.
  • The effect of sample site and collection procedure on identification of SARS-CoV-2 infection.
    Davenport C, Arevalo-Rodriguez I, Mateos-Haro M, Berhane S, Dinnes J, Spijker R, Buitrago-Garcia D, Ciapponi A, Takwoingi Y, Deeks JJ, Emperador D, Leeflang MMG, Van den Bruel A; Cochrane COVID-19 Diagnostic Test Accuracy Group. Davenport C, et al. Cochrane Database Syst Rev. 2024 Dec 16;12(12):CD014780. doi: 10.1002/14651858.CD014780. Cochrane Database Syst Rev. 2024. PMID: 39679851 Free PMC article.

Cited by

References

    1. Swadling L., Diniz M.O., Schmidt N.M., et al. Pre-existing polymerase-specific T cells expand in abortive seronegative SARS-CoV-2. Nature. 2022;601:110–117. - PMC - PubMed
    1. Peng Y., Mentzer A.J., Liu G., et al. Broad and strong memory CD4(+) and CD8(+) T cells induced by SARS-CoV-2 in UK convalescent individuals following COVID-19. Nat Immunol. 2020;21:1336–1345. - PMC - PubMed
    1. Le Bert N., Clapham H.E., Tan A.T., et al. Highly functional virus-specific cellular immune response in asymptomatic SARS-CoV-2 infection. J Exp Med. 2021;218 - PMC - PubMed
    1. Kundu R., Narean J.S., Wang L., et al. Cross-reactive memory T cells associate with protection against SARS-CoV-2 infection in COVID-19 contacts. Nat Commun. 2022;13:80. - PMC - PubMed
    1. Fenn J., Madon K., Conibear E., et al. An ultra-early, transient interferon-associated innate immune response associates with protection from SARS-CoV-2 infection despite exposure. eBioMedicine. 2024;111 - PMC - PubMed

Substances