. 2025 Jul;301(7):110330.
doi: 10.1016/j.jbc.2025.110330. Epub 2025 Jun 3.

Biosynthesis of fatty aldehydes and alcohols in the eye and their role in meibogenesis

Affiliations

Biosynthesis of fatty aldehydes and alcohols in the eye and their role in meibogenesis

Seher Yuksel et al. J Biol Chem. 2025 Jul.

Abstract

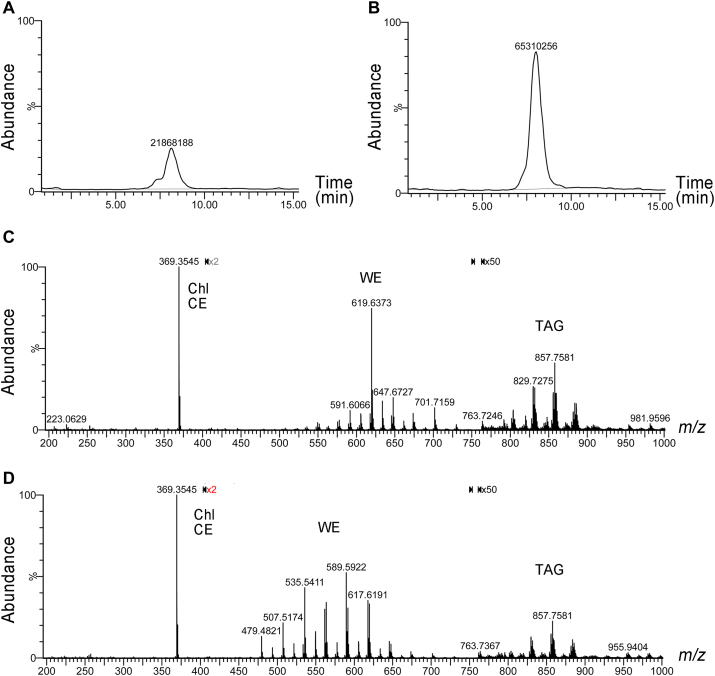
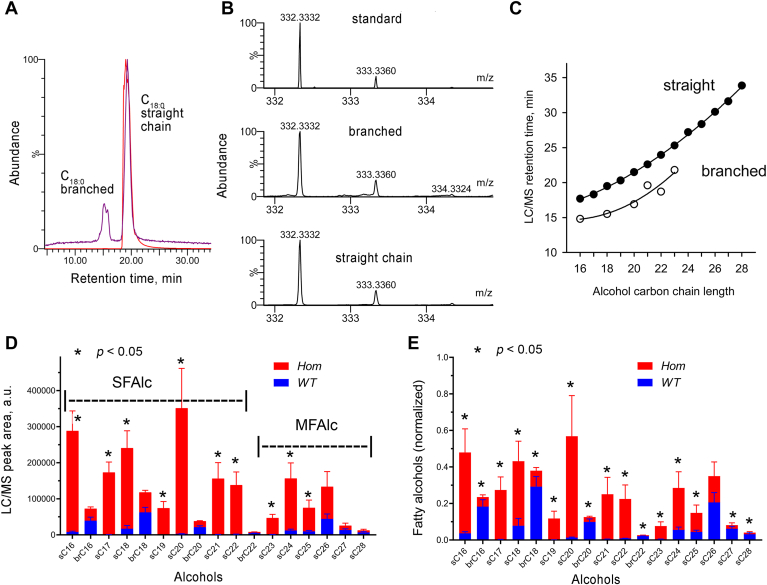
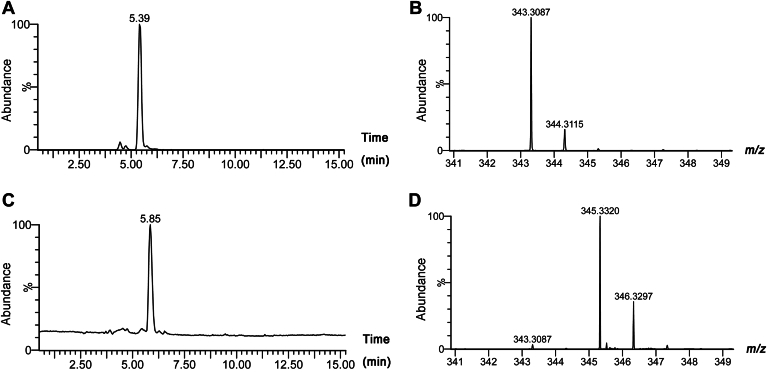
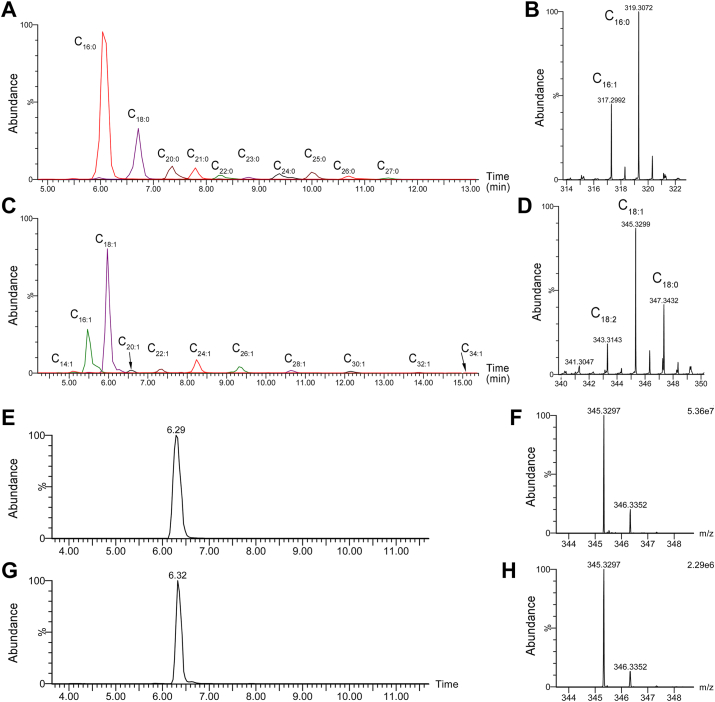
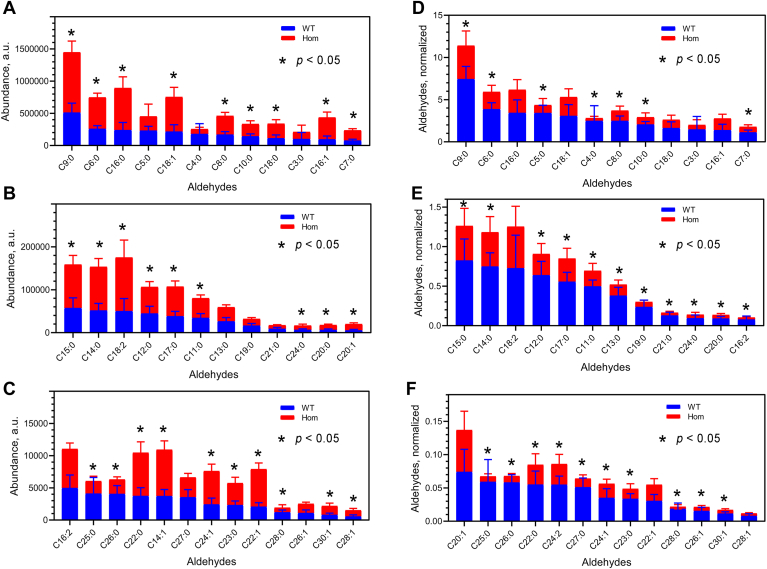
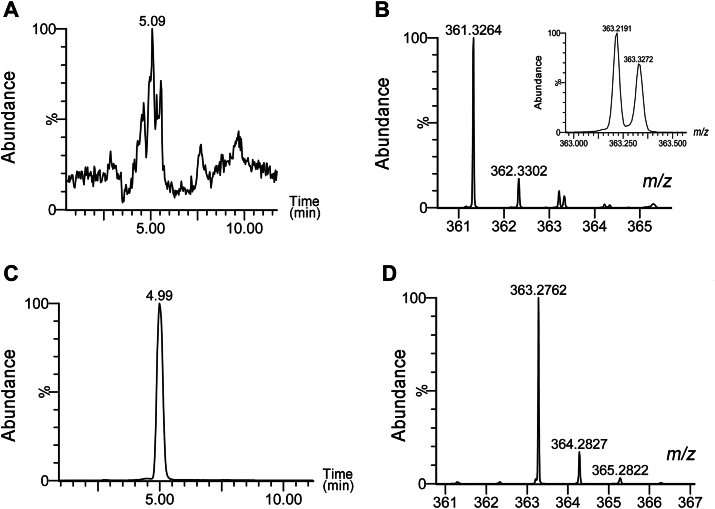
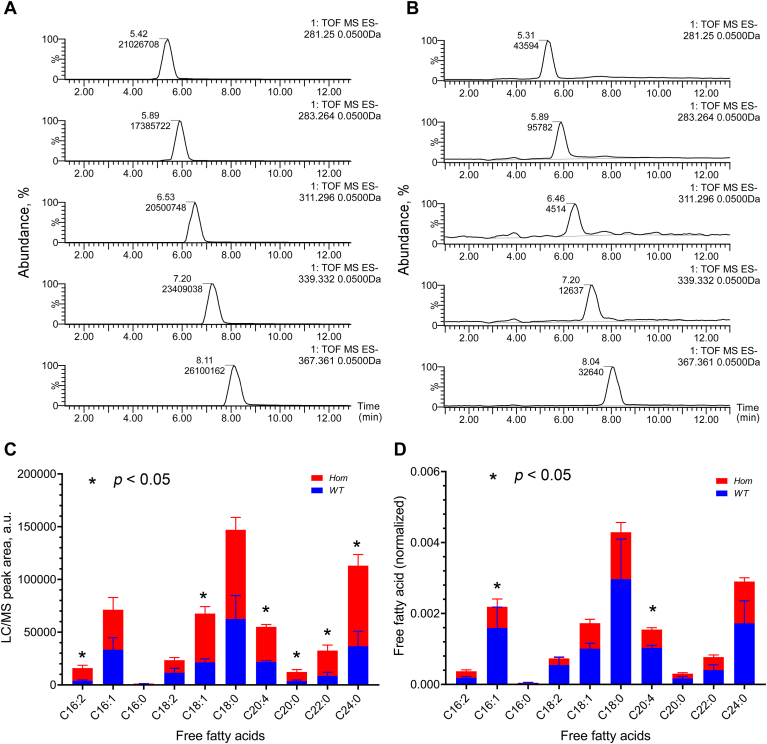
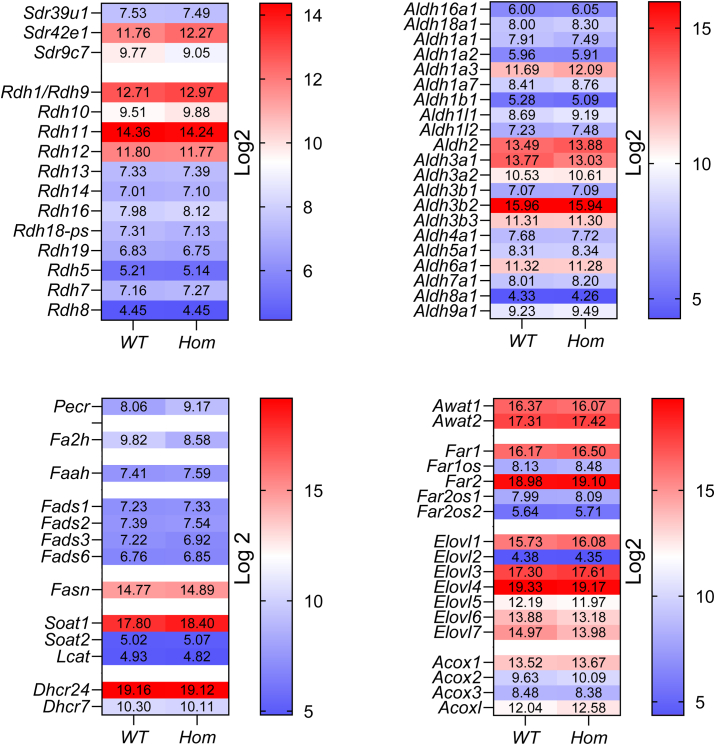
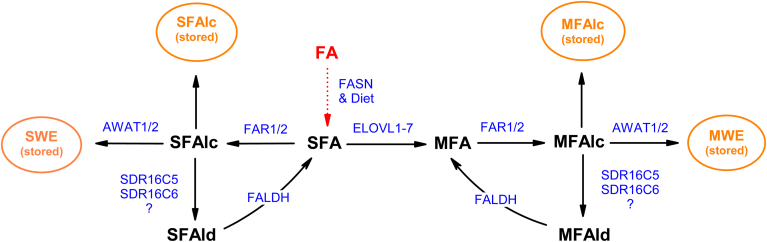
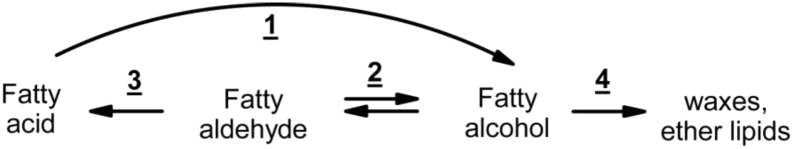
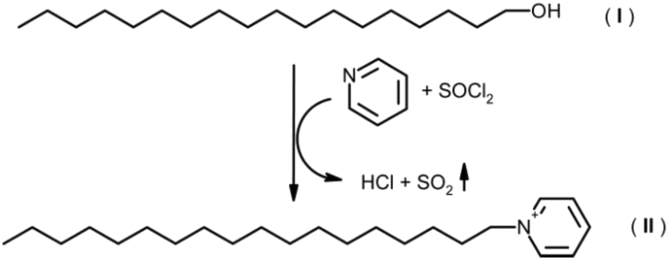
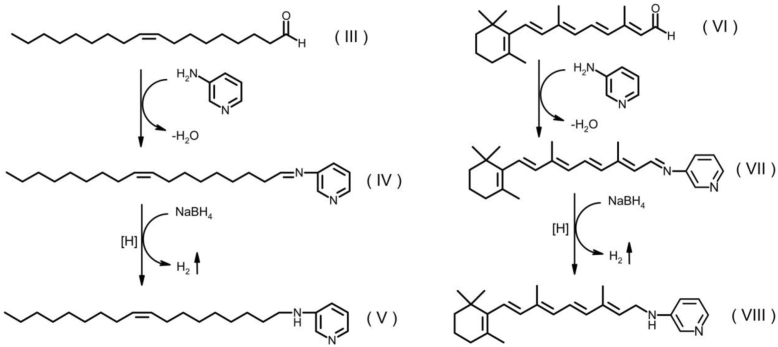
Fatty alcohols (FAlc) and aldehydes (FAld) are essential intermediates/precursors in the biosynthesis of lipids. However, elevated FAld levels were shown to be geno- and cytotoxic, thus requiring conversion into less toxic FAlc and fatty acids (FA). An increase in FAlc and FAld in tissues of patients with Sjögren-Larsson syndrome was reported before and repeatedly linked to inactivation of ALDH3A2, which oxidizes FAld in FA. Recently, we hypothesized that another group of enzymes, namely SDR16C5/SDR16C6 (EC 1.1.1.105), could control the balance between FA, FAlc, and FAld via a separate mechanism. In this study, we assessed the in vivo biosynthesis of FAlc and FAld in mammals using Meibomian glands (MG) of wild-type (WT) and Sdr16c5/Sdr16c6-null (Hom) mice as models. Lipids were extracted from MG of experimental animals and analyzed using LC/MS. Because of high reactivity and instability of FAld, the compounds were initially converted to stable, sodium borohydride-reduced 3-aminopyridine conjugates, while FAlc were analyzed as N-alkyl pyridinium ions. A wide range of saturated and unsaturated FAld, FAlc, and FA ranging from C3 to C28 and longer were found in MG of mice of both genotypes. Our experiments revealed a multifold upregulation of almost all detected straight chain, but not branched, FAlc in MG lipidomes of Hom mice, which implied a previously unknown ability of SDR16C5/SDR16C6 to oxidize a wide range of FAlc in FAld in vivo. We have concluded that SDR16C5/SDR16C6 plays a central, and selective, role in FA/FAlc/FAld metabolism in vivo and proposed a generalized mechanism of these reactions.

Keywords: Meibomian glands; chromatography/mass spectrometry; fatty acids; fatty alcohols; fatty aldehydes; lipids; lipogenesis; meibogenesis.


Conflict of interest statement

Conflict of interest The authors declare that they have no conflicts of interest with the contents of this article.

Figures

Figure 1
Figure 1
Lipidomic analyses of wild-type and Sdr16c5/Sdr16c6 double-knockout mouse tarsal plate lipids. A, total ion chromatogram of wild type lipids obtained using isocratic elution from a C8 column and mass spectrometric detection in APCI PIM. The LC/MS peak area is shown at the top of the peak. B, total ion chromatogram of Hom type tarsal plate lipids obtained as described in (A). C, observation mass spectrum of a representative wild type specimen obtained by combining spectra recorded in the 5 min to 12 min interval. D, observation mass spectrum of Hom specimen. Note that parts of the spectra shown in (C) and (D) were magnified for clarity (marked as 2 × and 50 ×).
Figure 2
Figure 2
Fatty alcohol profiling of mouse tarsal plates using their conversion to N-alkyl pyridinium ions. A, extracted ion chromatograms of a N-alkyl pyridinium derivative of authentic straight chain stearyl alcohol (red trace) and two isobaric geometrical isomers of the compound (branched and straight chain) detected in mouse tarsal plates (purple trace). The elution times of the standard and the major isoform in mouse extract were identical. Error bars – standard deviations. B, high-resolution mass spectra of authentic straight chain, and mouse-derived branched and straight chain N-stearyl pyridinium ions. C, chromatographic retention times of straight chain (closed circles) and branched N-alkyl pyridiniums. Note a systematically shorter retention times of branched lipids compared to their isobaric straight chain counterparts. D, total fatty alcohol profiles of mouse tarsal plates. Blue bars – wild type mice (n = 5); red barsHom mice (n = 5). The results are shown as a stacked bar graph. The apparent LC/MS peak areas were calculated from extracted ion chromatograms for each compound and used to compare the samples. E, normalized (partial) fatty alcohol profiles of mouse tarsal plates. The results shown in (D) were normalized per total lipid detected in the samples as shown in Figure 1, A and B. br, branched chain; MFAL, longer-chain, Meibomian-type fatty alcohols; s, straight chain; SFAL, shorter-chain sebaceous-type fatty alcohols. D and E, the WT-to-Hom comparisons for each analyte were conducted using a False Discovery Rate two-stage linear step-up procedure of Benjamini, Krieger and Yekutieli, with Q = 5% (64).
Figure 3
Figure 3
Reverse phase LC/MS analysis of derivatized fatty aldehyde (III). The products were separated on a C18 LC/MS column using gradient elution and detected in ESI PIM as described in Experimental procedures section. A, extracted ion chromatogram of non-reduced compound IV. B, Mmass spectrum of compound IV. C, extracted ion chromatogram of sodium borohydride-reduced compound V. Panel D. Mass spectrum of compound V.
Figure 4
Figure 4
Fatty aldehyde profiling of wild type mouse tarsal plates using C18 LC/MS ESI PIM. Panel A. Overlapped extracted ion chromatograms of NaBH4-reduced 3-aminopyridine-derivatives (3APy) of saturated fatty aldehydes detected in mouse tarsal plates. Panel B. Mass spectra of 3APy-derivatized C16:1 and C16:0 aldehydes detected in mouse samples. Panel C. Overlapped extracted ion chromatograms of NaBH4-reduced 3APy-derivatives of major unsaturated fatty aldehydes. Panel D. Mass spectra of 3APy-derivatives of C18:0, C18:1 and C18:2 aldehydes. Panel E. Extracted ion chromatogram of authentic 3APy-derivative of olealdehyde. Panel F. Mass spectrum of authentic 3APy-derivative of olealdehyde. Panel G. Extracted ion chromatogram of mouse 3APy-derivative of olealdehyde. Panel H. Mass spectrum of mouse 3APy-derivative of olealdehyde.
Figure 5
Figure 5
Total fatty aldehydes profiles of wild-type (WT) and mutant (Hom) mouse tarsal plates. The data are shown as stacked bars. Blue bars – wild type mice (n = 7). Red barsHom mice (n = 10). Error bars – standard deviations. Compounds labeled with asterisks differed significantly between WT and Hom mice. A–C, raw LC-MS peaks areas obtained as extracted ion chromatograms of NaBH4-reduced individual 3APy-FAld conjugates. D-F, normalized (partial) data from (A–C). All panels: the WT-to-Hom comparisons for each analyte were conducted using a False Discovery Rate two-stage linear step-up procedure of Benjamini, Krieger and Yekutieli, with Q = 5% (64).
Figure 6
Figure 6
Testing for the presence of retinaldehyde in mouse tarsal plates and retina using C18-LC/MS ESI PIM. A, in tarsal plate samples, extracted ion chromatogram of ion m/z (363.2779 ± 0.050) showed only weak features with retention times between 3 and 7 min. B, the LC-MS peak shown in Panel A produced a mass spectrum with a major signal with m/z 361.3264, and a feature slightly above m/z 363. A close examination of the feature revealed two signals (Insert), none of which matched the signal of authentic NaBH4-reduced 3APy-derivative of retinaldehyde (compound VIII). C, extracted ion chromatogram of a reduced 3APy-derivative of retinaldehyde with m/z 363.2762 in mouse retina. D, mass spectrum of NaBH4-reduced 3APy-retinaldehyde from mouse retina.
Figure 7
Figure 7
Profiling of fatty acids in mouse tarsal plates. A, extracted ion chromatograms of an equimolar mixture of five authentic fatty acids: 1) oleic acid (m/z 281.25, C18:1); 2) stearic acid (m/z 283.26, C18:0); 3) eicosanoic acid (m/z 311.296, C20:0); 4) docosanoic acid (m/z 339.33, C22:0); 5) tetracosanoic acid (m/z 367.36, C24:0). Panel B. Extracted ion chromatograms of fatty acids in a wild type mouse tarsal plates (same as in A). C, total fatty acids profiles of WT (n = 5) and Hom (n = 5) mouse tarsal plates (stacked bars). Error bars – standard deviations. D, normalized fatty acid profiles (data from (C) shown as stacked bars). Error bars – standard deviations. C and D, the WT-to-Hom comparisons for each analyte were conducted using a False Discovery Rate two-stage linear step-up procedure of Benjamini, Krieger and Yekutieli, with Q = 5% (64). Labeling of the panels: 1. TOF MS ESI- – Time-of-Flight Mass Spectrometric experiment conducted in ElectroSpray Ionization Negative Ion Mode; m/z values for extracted ion chromatograms ± Δ m/z mass tolerance window.
Figure 8
Figure 8
Averaged gene expression profiles in tarsal plates of wild-type (n = 3) and homozygous Sdr16c5/Sdr16c6-double knockout (n = 4) mice. Genes related to cholesterol and fatty acid biosynthesis, desaturation, elongation, esterification, transport, and storage are shown. See Table S2 for further details.
Figure 9
Figure 9
A mechanistic model of wax ester, fatty alcohol, and fatty aldehyde biosynthesis in Meibomain glands. The model is based on previously described functions of several enzymes such as AWAT1/2 (32, 33, 34, 35), FAR1/FAR2 (36), ELOVL1-7 (37, 38, 39), and high levels of expression of various Aldh's that encode ALDH's in Meibomian glands of humans and mice (Fig. 8). FA, fatty acids formed in situ or obtained from diet; MFA, longer-chain, Meibomian-type fatty acids; MFAlc, longer-chain, Meibomian-type fatty alcohols; MFAld, longer-chain Meibomian-type fatty aldehydes; MWE, longer-chain, Meibomian-type wax esters; SFA, shorter-chain, sebaceous-type fatty acids; SFAlc, shorter-chain, sebaceous-type fatty alcohols; SFAld, shorter-chain, sebaceous-type fatty aldehydes; SWE, shorter-chain, sebaceous-type wax esters.
None
None
None

Similar articles

References

    1. Nicolaides N., Kaitaranta J.K., Rawdah T.N., Macy J.I., Boswell F.M., 3rd, Smith R.E. Meibomian gland studies: comparison of steer and human lipids. Invest. Ophthalmol. Vis. Sci. 1981;20:522–536. - PubMed
    1. Butovich I.A., Uchiyama E., McCulley J.P. Lipids of human meibum: mass-spectrometric analysis and structural elucidation. J. Lipid. Res. 2007;48:2220–2235. - PubMed
    1. Butovich I.A. Meibomian glands, meibum, and meibogenesis. Exp. Eye. Res. 2017;163:2–16. - PMC - PubMed
    1. Nicolaides N. The monoene and other Wax alcohols of human skin surface lipid and their relation to the fatty acids of this lipid. Lipids. 1967;2:266–275. - PubMed
    1. Nicolaides N., Fu H.C., Ansari M.N. Diester waxes in surface lipids of animal skin. Lipids. 1970;5:299–307. - PubMed

LinkOut - more resources