. 2025 Jun 5;16(1):5217.
doi: 10.1038/s41467-025-60468-z.

Optimizing enzyme inhibition analysis: precise estimation with a single inhibitor concentration

Affiliations

Optimizing enzyme inhibition analysis: precise estimation with a single inhibitor concentration

Hyeong Jun Jang et al. Nat Commun. .

Abstract

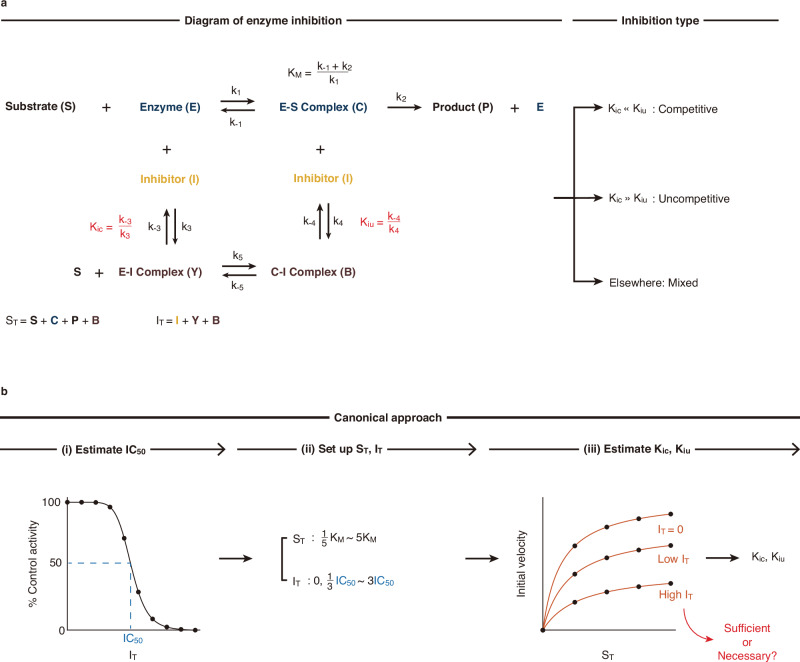
Enzyme inhibition analysis is essential in drug development and food processing, necessitating precise estimation of inhibition constants. Traditionally, these constants are estimated through experiments using multiple substrate and inhibitor concentrations, but inconsistencies across studies highlight a need for a more systematic approach to set experimental designs across all types of enzyme inhibition. Here, we address this by analyzing the error landscape of estimations in various experimental designs. We find that nearly half of the conventional data is dispensable and even introduces bias. Instead, by incorporating the relationship between IC50 and inhibition constants into the fitting process, we find that using a single inhibitor concentration greater than IC50 suffices for precise estimation. This IC50-based optimal approach, which we name 50-BOA, substantially reduces (>75%) the number of experiments required while ensuring precision and accuracy. Additionally, we provide a user-friendly package that implements the 50-BOA.


Conflict of interest statement

Competing interests: The authors declare no competing interests.

Figures

Fig. 1
Fig. 1. The canonical approach for estimating inhibition constants.
a An inhibitor (I) can suppress the enzyme-catalyzed reaction from a substrate (S) to a product (P) by binding to a free enzyme (E) (competitive), enzyme-substrate complex (C) (uncompetitive), or both (Mixed), forming reversible complexes (Y and B). Here, ST=S+C+P+B and IT=I+Y+B denote the total substrate and inhibitor concentrations, respectively, and KM=k2+k1k1 denotes the Michaelis-Menten (MM) constant. The dissociation constants of each binding (Kic=k3k3 and Kiu=k4k4), known as the inhibition constants, determine which inhibition type is dominant. b The canonical approach for estimating the inhibition constants and types involves the following steps: (i) The inhibitor concentration leading to half of the % control activity (IC50) is estimated from experiments with a single ST and varying IT. Here, the % control activity is the percentage ratio of the initial velocity with inhibitor to the initial velocity without inhibitor. (ii) For various combinations of ST values ranging from 15KM to 5KM and IT values ranging from 13IC50 to 3IC50, including IT=0, initial velocities are measured. (iii) By fitting Eq. 1 to the initial velocity data, the inhibition constants are estimated. It is unclear whether the dataset used in the canonical approach is sufficient or necessary for precise estimation.
Fig. 2
Fig. 2. Using a single inhibitor concentration larger than inhibition constants leads to precise estimation.
a The initial velocity data (red dots), obtained based on a true Kic and Kiu pair with a single IT value and several ST values (see “Methods” for details), were compared with Eq. 1 of different parameter pairs (e.g., solid and dashed lines). b For each parameter pair, the fitting error between Eq. 1 and the data was calculated. The heatmap representing the fitting error landscape was plotted for a range of parameter pairs. c When IT=0.1 μM was much smaller than the true parameter values (Kic=Kiu=1 μM), a wide range of parameter pairs (e.g., ▲, ▼, ●) led to low fitting errors, indicating imprecise estimation. d The fitted curves with these parameter pairs matched the data well. ef When IT=2 μM was greater than the true Kic=1 μM but smaller than the true Kiu=10 μM, the pairs of the same Kic but distinct Kiu values (e.g., ▲, ●) led to accurate fitting, indicating precise Kic but not Kiu estimation. g, h Conversely, when IT=2 μM exceeded the true Kiu=1 μM but much smaller than the true Kic=10 μM, the pairs of the same Kiu but distinct Kic values (e.g., ▼, ●) led to accurate fitting, Indicating precise Kiu but not Kic estimation. i, j When IT=10 μM was greater than or comparable to both true parameter values (Kic=Kiu=1 μM), precise estimation for both Kic and Kiu is possible (●). For c-j, the true data were obtained with ST=0.2KM, KM, and 5KM (KM=1 μM). The initial velocity data were normalized by Vmax=0.1 μM/min/mgprotein.
Fig. 3
Fig. 3. Using an inhibitor concentration above IC50 with IC50 regularization allows for precise estimation.
a IC50, measured with ST, is a weighted harmonic mean of Kic and Kiu, with the weight of α=KMST+KM (Eq. 2). bd Since IC50 is always greater than either Kic or Kiu, using ITIC50 allows for precise estimation of Kic (b), Kiu (c), or both (d) when Kic and Kiu differ within 10-fold (See Supplementary Fig. 1 for other cases). e With known IC50, the unknown Kic and Kiu need to satisfy the weighted harmonic mean equation, HKic,Kiu=IC50, which can be incorporated into estimation via a regularization term (regularization error; Eq. 3). f–h The heatmap shows regularization error, where the low regularization error region (black region) corresponds to the Kic and Kiu values satisfying the constraint HKic,Kiu=IC50. i–k Incorporating the regularization error into the fitting error (total error) allowed for precise estimation of Kic and Kiu (dashed lines), reducing the low error region (black region) compared to unregularized cases (b–d). l IC50-based optimal approach (50-BOA) uses only a single ITIC50 along with the IC50 regularization, considerably reducing the number of required experiments for precise and accurate estimation, compared to the canonical approach (Fig. 1b).
Fig. 4
Fig. 4. The 50-BOA enables precise and accurate estimation for experimental mixed inhibition data.
a The normalized initial velocities (V0Vmax; Vmax=1.02 μM/min−1/mg protein) of triazolam with its inhibitor ketoconazole (IC50=0.040 μM when ST=50 μM; KM=72 μM) were measured for various triazolam (ST=10, 25, 50, 100, 250, and 500 μM) and ketoconazole (IT=0, 0.01, 0.025, 0.05, 0.1, 0.25, and 0.5 μM) concentration combinations, and fitted with Eq. 1 (solid lines). b Heatmaps of the total errors without (upper row) and with (lower row) regularization for entire or single IT setups. Using the entire IT range (i.e., canonical condition) led to precise Kic and Kiu estimation, identifying mixed inhibition. For single IT setups, when IT < IC50 (e.g., IT=0.01 μM), estimation of Kic and Kiu was imprecise, as indicated by the low-error markers at Kic=0.041 μM, Kiu=0.041 μM (circle), Kic=0.041 μM, Kiu=100 μM (triangle), and Kic=100 μM, Kiu=0.041 μM (rectangle). However, precision became comparable to the canonical condition as IT increased through ITIC50 (e.g., IT=0.05 μM) to IT>IC50 (e.g., IT=0.5 μM). Regularization enhanced precision to match the canonical condition. c, d Estimated parameters (dots and asterisks) and 95% confidence intervals (error bars). Utilizing a single IT lower than IC50 led to inaccurate and imprecise estimations for Kic and Kiu (i.e., out of the 1.5-fold range (dotted lines) of the estimated parameters (triangle)). On the other hand, the 50-BOA (e.g., IT=0.5 μM; diamonds) allows for precise and accurate estimation of both parameters comparable to the canonical condition (c, d). e The 50-BOA (diamonds) requires only one seventh of the experiments required for the canonical condition (triangle) with comparable precision and accuracy.
Fig. 5
Fig. 5. The 50-BOA allows for precise and accurate estimation for experimental competitive inhibition data.
a The normalized initial velocities (V0Vmax; Vmax=11.77 μM/min−1/mg protein) of chlorzoxazone with its inhibitor ethambutol (IC50=4 μM when ST=50 μM; KM=39.1 μM) were measured for various chlorzoxazone (ST=12.5, 25, 50, 75, and 100 μM) and ethambutol (IT=0, 0.41, 1.23, 3.7, and 11.1 μM) concentration combinations and fitted with Eq. 1 (solid lines). b Heatmaps of the total errors without (upper row) and with (lower row) regularization for entire IT or single IT setups. Using the entire IT (i.e., canonical condition) led to precise Kic estimation, while Kiu estimation remained imprecise in a wide range even with regularization, indicating competitive inhibition. For single IT setups, the precision of the Kic estimation became comparable to the canonical condition, as IT increased from IT<IC50 (e.g., IT=0.41 μM) through ITIC50 (e.g., IT=3.7 μM) to IT>IC50 (e.g., IT=11.1 μM). c The Kic values (dots) with 95% confidence intervals (error bars) estimated with regularization. Using a single IT lower than IC50 led to inaccurate or imprecise estimation (i.e., out of the 1.5-fold range (dotted lines) of the estimated Kic (triangle)), while the 50-BOA (diamond) enables precise and accurate estimation comparable to the canonical condition. d The asymptotic distribution of estimated Kiu (see “Methods” for details) from the canonical condition is located at a substantially high value (1016 μM; dotted rectangle), reflecting the competitive inhibition type. Using a single IT lower than IC50 led to an unexpected mode near 10 μM (dashed rectangle), indicating potential misclassification of the inhibition type as mixed. Conversely, the 50-BOA provides Kiu distribution consistent with the canonical condition, avoiding such misclassification. e The 50-BOA (diamond) requires only one fifth of the experiments required for the canonical condition (triangle) with comparable precision and accuracy.

Similar articles

References

    1. Manikandan, P. & Nagini, S. Cytochrome P450 structure, function and clinical significance: a review. Curr. drug targets19, 38–54 (2018). - PubMed
    1. Iyanagi, T. Molecular mechanism of phase I and phase II drug‐metabolizing enzymes: implications for detoxification. Int. Rev. Cytol.260, 35–112 (2007). - PubMed
    1. Pelkonen, O. et al. Inhibition and induction of human cytochrome P450 enzymes: current status. Arch. Toxicol.82, 667–715 (2008). - PubMed
    1. Food, U. & Administration, D. In vitro drug interaction studies-cytochrome P450 enzyme and transporter mediated drug interactions. FDA Guid1, 1 (2020).
    1. Fahmi, O. A. et al. A combined model for predicting CYP3A4 clinical net drug-drug interaction based on CYP3A4 inhibition, inactivation, and induction determined in vitro. Drug Metab. Disposition36, 1698–1708 (2008). - PubMed

MeSH terms

Substances

LinkOut - more resources