. 2025 Jun 6;10(1):181.
doi: 10.1038/s41392-025-02263-2.

Microbiota-derived butyrate alleviates asthma via inhibiting Tfh13-mediated IgE production

Affiliations

Microbiota-derived butyrate alleviates asthma via inhibiting Tfh13-mediated IgE production

Baichao Yu et al. Signal Transduct Target Ther. .

Abstract

Gut microbiota-derived short-chain fatty acids (SCFAs) impact asthma outcomes, highlighting the importance of understanding the disease mechanisms through the gut-lung axis. In this study, we identified that among SCFAs, butyrate uniquely alleviates asthma through specifically inhibiting a newly identified pathogenic T follicular helper (Tfh) cell subset, Tfh13 cells. Tfh13 cell depletion (Il13Cre/+Bcl6fl/fl) or adoptive transfer of Tfh13 cells in an OVA-induced asthma model conclusively demonstrated their indispensable role in driving anaphylactic IgE production and asthma pathogenesis. Mechanistically, the inhibitory function of butyrate on Tfh13 cells is mediated by the interaction between butyrate and G-protein coupled receptor 43 (GPR43), leading to the suppression of p38 MAPK/NF-κB signaling in Tfh13 cells. To address the clinically observed deficiency of butyrate in patients with asthma and recapitulated in murine models, we developed a novel therapeutic strategy using a butyrate-yielding diet enriched with butylated high amylose maize starch (HAMSB). Remarkably, supplementation with HAMSB diet in murine and humanized asthma models significantly reduced Tfh13 cell frequencies and anaphylactic IgE levels, leading to significantly improved disease outcomes. Our findings not only unveil a novel mechanism underlying butyrate-mediated asthma alleviation, termed the butyrate-Tfh13-IgE axis, but also propose a clinically translatable dietary intervention strategy targeting microbial metabolites for stopping asthma.


Conflict of interest statement

Competing interests: The authors declare no competing interests.

Figures
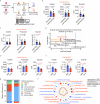
Fig. 1
Fig. 1
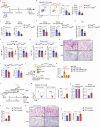
Decreased butyrate levels in patients with asthma and murine models. a Experimental scheme for SCFA levels detected by gas chromatography with mass spectrometry (GC/MS) in human and murine samples. b Stool acetate, propionate, and butyrate levels in healthy donors (HD, n = 25) and patients with asthma (n = 25). c Plasma acetate, propionate, and butyrate levels in healthy donors (n = 25) and patients with asthma (n = 25). d qPCR for main butyrate-producing bacteria detection in stools of HD (n = 7) and patients with asthma (n = 9). e Cecal acetate, propionate, and butyrate levels in the PBS group and OVA-induced asthma model. (n = 6/group) f BALF acetate, propionate, and butyrate levels in the PBS group and OVA-induced asthma model. (n = 6/group) g The taxonomic composition bar plots show the abundance of bacterial communities at the phylum level in the PBS group and the OVA-induced asthma model. (cumulative n = 6/group). h The radar charts show differences in bacterial taxa at the family level between the PBS group and the OVA-induced asthma model. (cumulative n = 6/group). Each symbol represents one mouse. Data combined for at least two independent experiments (b, c) or were representative of three independent experiments (e, f). Data represent mean ± SEM analyzed by unpaired t-test/nonparametric test (b, c, e, and f)
Fig. 2
Fig. 2
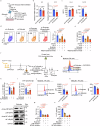
Butyrate inhibits Tfh13 cells to regulate IgE production. a Experimental scheme for single-cell RNA sequencing of mediastinal lymph nodes (MedLNs) isolated from asthmatic mice with/without butyrate supplementation. Four mice were pooled per group. b Uniform manifold approximation and projection (UMAP) of CD4+ T cell clusters. c Heatmap of signature genes in each CD4+ T cell cluster. d The distribution of each CD4+ T cell cluster in w/o butyrate and w/ butyrate group. e Flow cytometry analysis of the frequency and number of Tfh cells in MedLNs. Representative plots (left) and statistical results (right) were shown. (n = 6/group) f Cell communication analysis based on CellChat. g The expression of selected genes in Tfh and non-Tfh clusters. h Flow cytometry analysis of the frequency and number of Tfh13 cells in MedLNs. Representative plots (left) and statistical results (right) were shown. (n = 8–9/group) i Flow cytometry analysis of the frequency of OVA-specific Tfh13 cells, OVA-specific anergic T cells, and OVA-specific Tregs in MedLNs. Statistical results were shown. (n = 6/group) The cells were gated on CD4+TCRV2α+CD44+PD-1+CXCR5+ OT-II cells. j Total and OVA-specific IgE were quantified using ELISA, as well as the anaphylactic capacity of the samples was assessed through PCA assay. (n = 6/group) Each symbol represents one mouse. Data combined from three independent experiments (h) or were representative of at least two independent experiments (e, i, and j) and represent mean ± SEM analyzed by unpaired t-test/nonparametric test (e, i, and j) and one-way ANOVA (h)
Fig. 3
Fig. 3
Tfh13 cells are indispensable for IgE production in allergic asthma. a OVA-induced asthma models were established in Bcl6fl/fl and Il13Cre/+Bcl6fl/fl mice. b Flow cytometry analysis of Tfh13 cells in Bcl6fl/fl and Il13Cre/+Bcl6fl/fl mice. Representative plots (left) and statistical results (right) were shown. (n = 13–14/group) c ELISA for total IgG1 and IgE detection. (n = 11–13/group) d ELISA for OVA-specific IgG1 and IgE detection. (n = 11–12/group) e Evans blue quantification for anaphylactic IgE detected by PCA assays. (n = 11–12/group) f Flow cytometry analysis of the MFI of IgG1 and IgE in GC B cells. Statistical results were shown. (n = 11–12/group) g Flow cytometry analysis of the MFI of IgG1 and IgE in plasma cells. (n = 12–13/group) Statistical results were shown. h Representative Hematoxylin and Eosin (H&E), as well as Periodic Acid-Schiff (PAS) staining of the lung sections and pathological score were shown in (i). Scale bars represent 500 μm. (n = 6/group) j Experiment scheme. CD4+CD44+PD-1+CXCR5+YFP+ Tfh13 cells and CD19+ B cells were sorted from MedLNs of Il-13YFP/Cre asthmatic mice and were cocultured in the presence or absence of butyrate. k Flow cytometry analysis of IgE+ B cells. Statistical results were shown. (n = 4/group) About 20 mice were pooled for one sample. Each symbol represents one sample. l Experiment scheme. Tfh13 (YFP+ Tfh cells) were sorted from MedLNs of IL-13-YFP reporter mice, and 1 × 104 sorted Tfh13 cells pooled from 12–15 IL-13-YFP reporter mice were injected into OVA-immunized Il13Cre/+Bcl6fl/fl mice via retro-orbital injection, followed by intranasal OVA for three consecutive days. m Flow cytometry analysis of YFP+ Tfh cells in transferred mice. Representative plots(left) and statistical results(right) were shown. n ELISA for OVA-specific IgG1 and IgE detection. o Evans blue quantification for anaphylactic IgE was detected by PCA assays. p Representative H&E and PAS staining of the lung sections and pathological score were shown in (q). Scale bars represent 500 μm. Data combined from at least two independent experiments (bi) or were representative of at least two independent experiments (k, lq) and represent mean ± SEM analyzed by unpaired t-test/nonparametric test (bg, i, mo, q) and one-way ANOVA (k)
Fig. 4
Fig. 4
Butyrate inhibits Tfh13 function in a GPR43-dependent manner. a Experimental scheme. Tfh cells were sorted from MedLNs from the asthma model and cultured in vitro with mrIL-6, anti-mouse ICOS mAb, and anti-mouse CD3 mAb in the presence or absence of butyrate. Ten to twelve mice were pooled for one sample. Each symbol represents one sample. b qPCR for the expression of Il4 and Il13mRNA levels. (n = 4/group) c IL-4 and IL-13 levels in the supernatant were detected by ELISA. (n = 4/group) d, e Tfh cells were cultured with butyrate in the presence of GLPG094 (GPR43 antagonist) or Mepenzolate bromide (GPR109a antagonist). d Flow cytometry analysis of Tfh13 cells. Representative plots (left) and statistical results (right) were shown. (n = 4/group) e ELISA for IL-13 levels in cultured supernatant. (n = 4/group) f Experimental scheme. OVA-immunized CD4+ T cells from the spleens of Il13YFP/Cre mice were cultured in vitro in the presence of butyrate with or without GLPG0974 for 48 h. These cells and OVA-immunized B cells were then adoptively transferred to Rag1−/− mice, followed by intranasal OVA for 3 days in a row. g, h Flow cytometry analysis of the MFI of IL-13 in Tfh cells. Representative plots (g) and statistical results (h) were shown. (n = 5/group) i OVA-specific IgE levels were detected by ELISA. (n = 5/group) j, k Flow cytometry analysis of phospho-p38 MAPK (j) and phospho-NF-κB p65 (k) levels in Tfh cells of asthmatic mice with or without butyrate supplementation. Representative plots (left) and statistical results (right) were shown. l CD4+ T cells from MedLNs of asthma models were cultured in vitro with mrIL-6, anti-mouse ICOS mAb, and anti-mouse CD3 mAb with or without butyrate. Cells were collected at 24 h for p38 MAPK/NF-κB signaling detection via immunoblot. m Flow cytometry analysis of Tfh13 cells. Statistical results were shown. (n = 4/group) n IL-13 levels in the supernatant were detected by ELISA in the presence of p38 MAPK or NF-κB inhibitors. (n = 4/group) A representative of three independent experiments was shown. Data represent mean ± SEM analyzed by unpaired t-test/nonparametric test (b, c, j, and k) and one-way ANOVA (d, e, hi, m, and n)
Fig. 5
Fig. 5
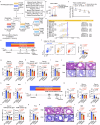
Butyrate-yielding diet protects against allergic asthma. a Experimental scheme. The adults (aged 20–79-years-old) who participated in the NHANES survey cycles of 2003 to 2018 were included in our study. Based on the inclusion criteria as shown in (a), 27660 subjects were included in our study and divided into three groups: current asthma (2327), ex-asthma (1577), and no asthma (23756). bd Dietary fiber intake data were acquired for further analysis. b Statistical results of dietary fiber intake in three groups were shown. c Dietary fiber intake levels were then divided into four quartiles. The correlation between the four quartiles and asthma prevalence was shown. d Multivariable logistic regression model analysis for the correlation between dietary fiber and asthma. Crude, unadjusted by covariates; Model 1, adjusted by age, sex, and race; Model 2, adjusted by age, sex, race, education, poverty index, body mass index (BMI), smoking status, and total calories. e Experimental scheme. Three weeks prior to OVA-induced asthma, AIN-93G were supplemented for one week of adaptation and then changed to HAMS or HAMSB diet for two weeks, and throughout the duration of the experiments. f Flow cytometry analysis of Tfh13 cells in MedLNs. Representative plots (left) and statistical results (right) were shown. (n = 9/group) g Total IgG1 and IgE levels were detected by ELISA. (n = 8–9/group) h OVA-specific IgG1 and IgE levels were detected by ELISA. (n = 8–9/group) i Anaphylactic IgE levels were detected by PCA assays. (n = 9/group) j Representative H&E and PAS staining of the lung sections and pathological score were shown in (k). The scale bar represents 25 μm. (n = 6/group) l Experimental scheme. Three weeks prior to HDM-induced asthma, AIN-93G were supplemented for one week of adaptation and then changed to HAMS or HAMSB diet for two weeks, and throughout the duration of the experiments. m Flow cytometry analysis of Tfh13 cells in MedLNs. Statistical results were shown. (n = 8–9/group) n Total IgG1 and IgE levels were detected by ELISA. (n = 7–9/group) o HDM-specific IgG1 and IgE levels were detected by ELISA. (n = 7–9/group) p Anaphylactic IgE levels were detected by PCA assays. (n = 7–9/group) q Representative H&E and PAS staining of the lung sections and pathological score were shown in (r). The scale bar represents 25 μm. (n = 5–6/group) NHANES database analysis based on R packages: survey and gtsummary (c, d). Each symbol represents one mouse. Data combined from at least two independent experiments (fk, mr). Data represent mean ± SEM analyzed by nonparametric test (b) and one-way ANOVA/nonparametric test (fi, k, mp, and r)
Fig. 6
Fig. 6
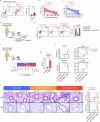
The potential clinical significance of butyrate on asthma. a Flow cytometry analysis of cTfh13 cells in human peripheral blood (PB). Representative plots (left) and statistical results (right) were shown. b, c The correlation between cTfh13 cells and butyrate levels in stools (b) and plasma (c). d Experiment scheme. PBMCs from HDM-allergic patients with asthma were collected and in vitro cultured with HDM, anti-human CD3 mAb, and anti-human CD28 mAb in the presence or absence of butyrate/GLPG0974 for 24 h. e Flow cytometry analysis of the frequency of human Tfh13 cells. Representative plots (left) and statistical results (right) were shown. (n = 3/group) f Experimental scheme. 5 × 106 PBMCs from HDM-allergic patients with asthma or PBS were adoptively transferred to NCG mice. Mice received intranasal HDM (50 μg) or PBS on days 0, 2, 4, 6, and 8. The HAMSB diet was administered from days 1 to 10, starting 1 day after PBMC transfer and during HDM or PBS challenges. Four vials of PBMC from four different donors were pooled for one sample g Butyrate levels in the cecum were detected by GC/MS. (n = 3/group) h Flow cytometry analysis of Tfh13 cells in MedLNs and PB. Statistical results were shown. (n = 2–3/group) i HDM-specific IgG1 and IgE levels were determined by ELISA. (n = 2–3/group) j Representative H&E and PAS staining of the lung sections and pathological score were shown in (k). The scale bar represents 75 μm. (n = 2–3/group) Data were representative of three independent experiments (e) and represent mean ± SEM analyzed by unpaired t-test/nonparametric test (a, g), one-way ANOVA (e), paired t-test (h, i, and k), and Spearman correlation (b, c)
Fig. 7
Fig. 7
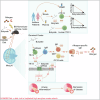
Schematic diagram summarizing the highlights of the study. The study’s key findings are: (1) Low butyrate levels relate to high cTfh13 frequencies in patients with asthma; (2) Butyrate constrains Tfh13-mediated allergen-specific IgE production; (3) Butyrate inhibits Tfh13 function by targeting GPR43/p38 MAPK/NF-κB axis; and (4) The HAMSB diet is a promising preventive and therapeutic approach for asthma. This figure was created using Adobe Illustrator software

Similar articles

Cited by

References

    1. Lynch, S. V. & Pedersen, O. The human intestinal microbiome in health and disease. N. Engl. J. Med.375, 2369–2379 (2016). - PubMed
    1. Espirito Santo, C., Caseiro, C., Martins, M. J., Monteiro, R. & Brandao, I. Gut microbiota, in the halfway between nutrition and lung function. Nutrients13, 1716 (2021). - PMC - PubMed
    1. Pabst, O. et al. Gut-liver axis: barriers and functional circuits. Nat. Rev. Gastroenterol. Hepatol.20, 447–461 (2023). - PubMed
    1. Glorieux, G., Nigam, S. K., Vanholder, R. & Verbeke, F. Role of the microbiome in gut-heart-kidney cross talk. Circ. Res.132, 1064–1083 (2023). - PubMed
    1. Fan, S. et al. Microbiota-gut-brain axis drives overeating disorders. Cell Metab.35, 2011–2027.e2017 (2023). - PubMed