. 2025 Jun 5;16(1):437.
doi: 10.1038/s41419-025-07755-1.

Muscle stem cells in Duchenne muscular dystrophy exhibit molecular impairments and altered cell fate trajectories impacting regenerative capacity

Affiliations

Muscle stem cells in Duchenne muscular dystrophy exhibit molecular impairments and altered cell fate trajectories impacting regenerative capacity

Jules A Granet et al. Cell Death Dis. .

Abstract

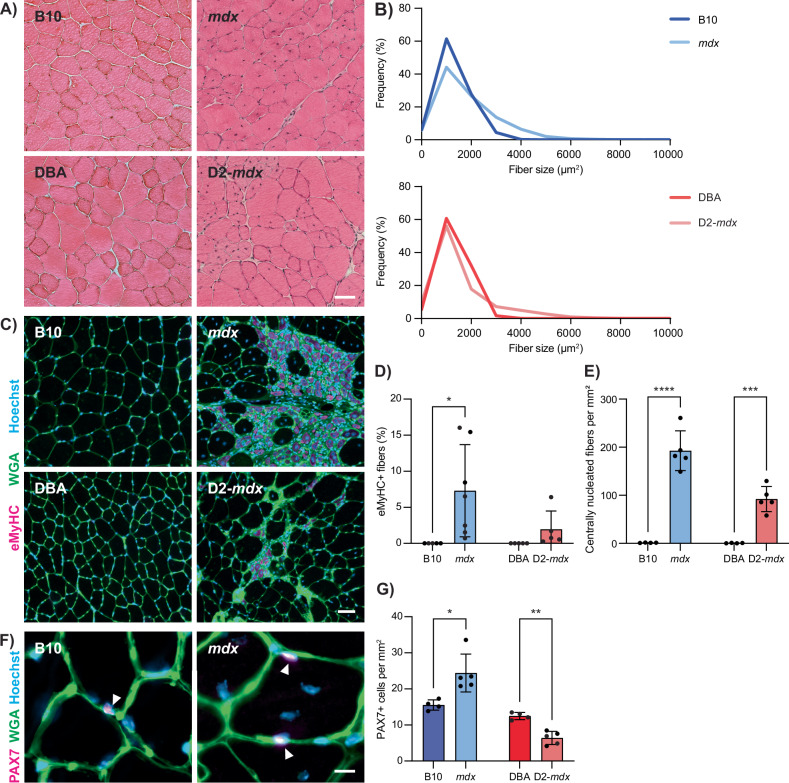
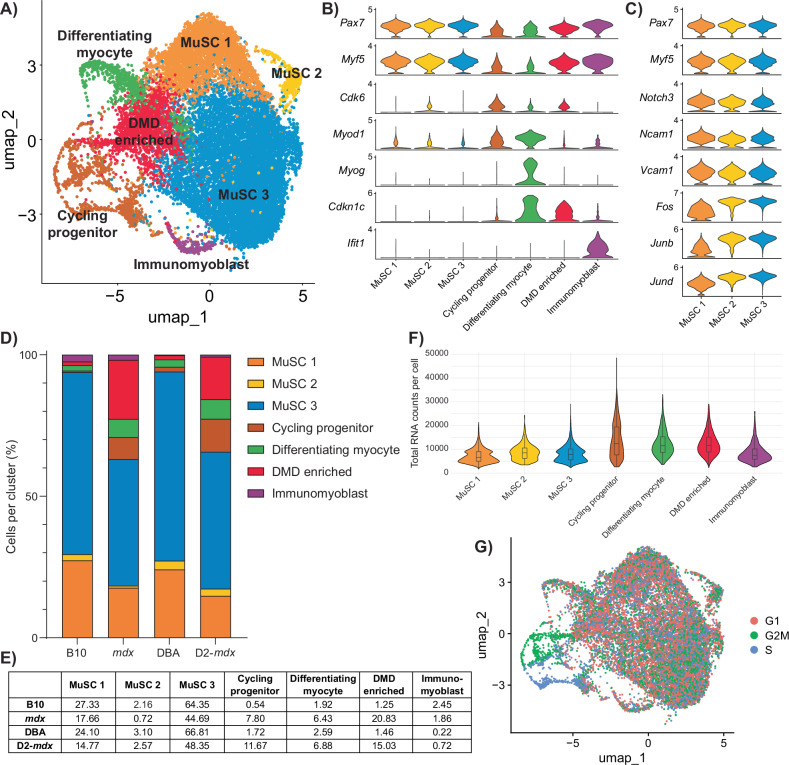
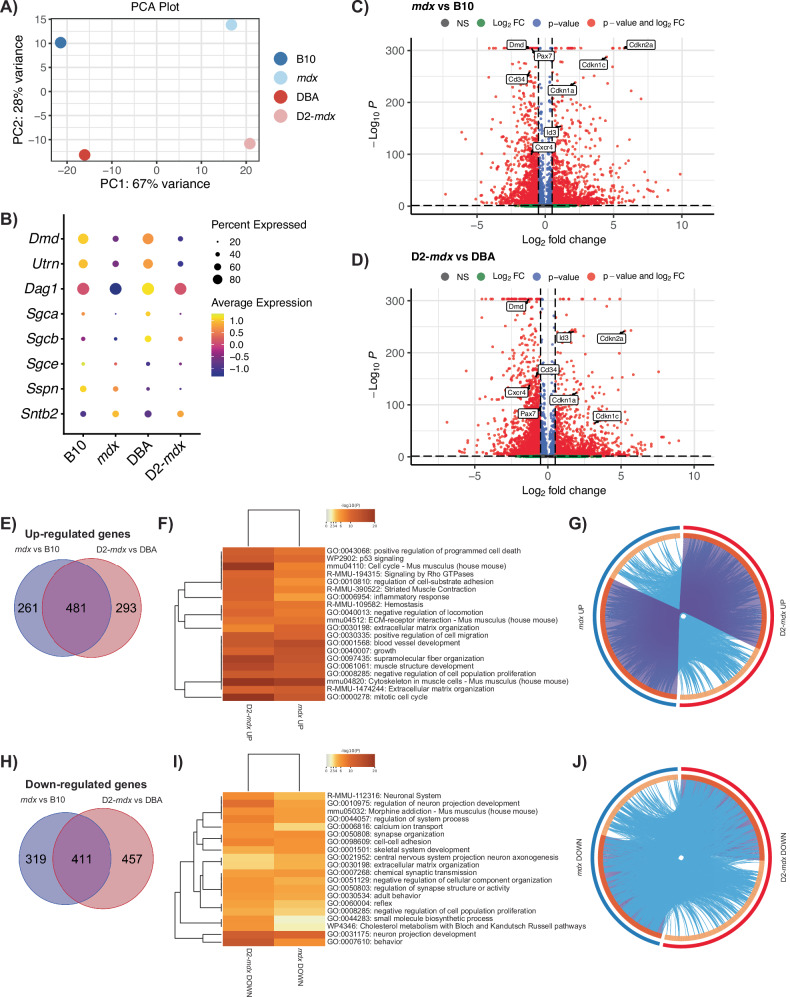
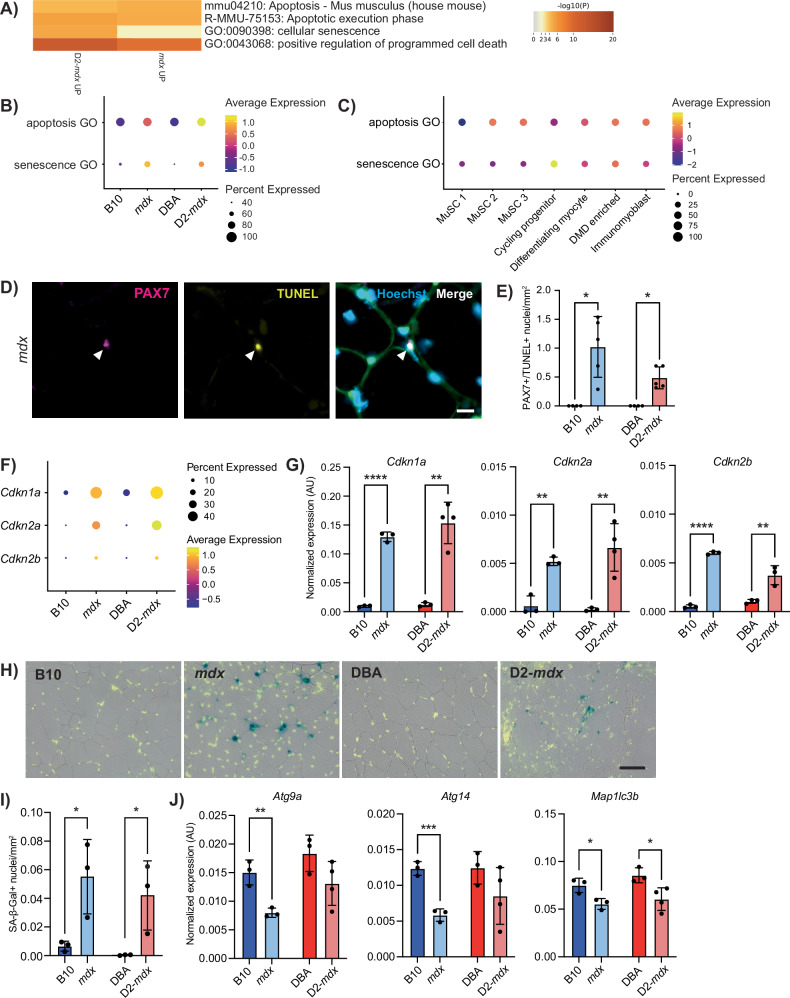
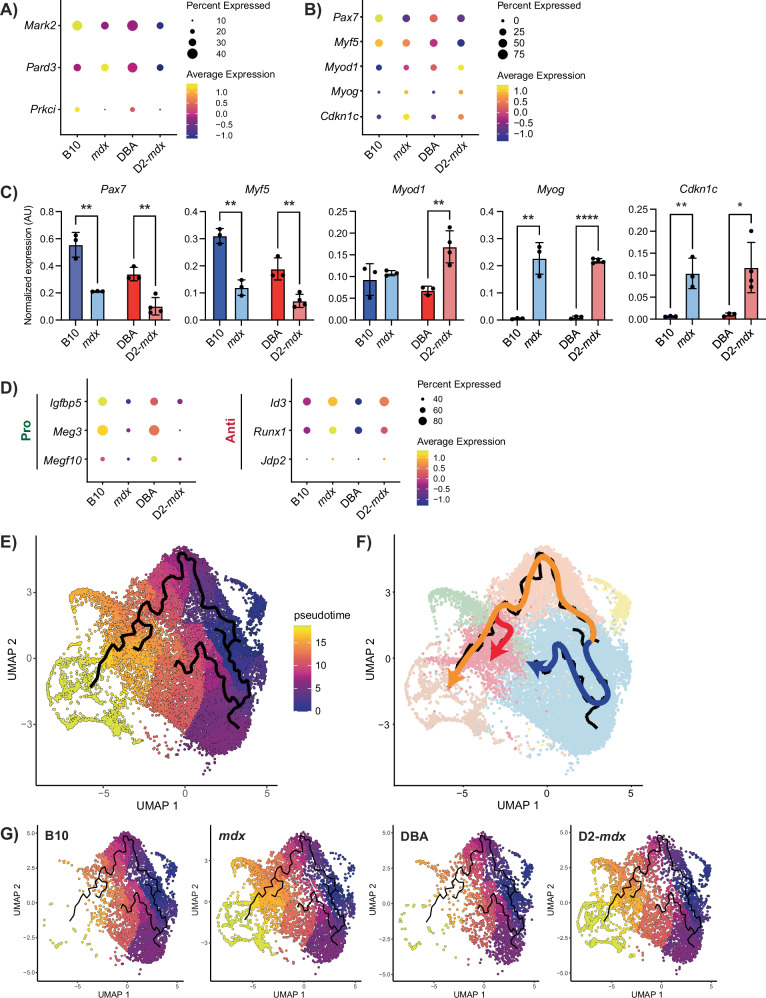
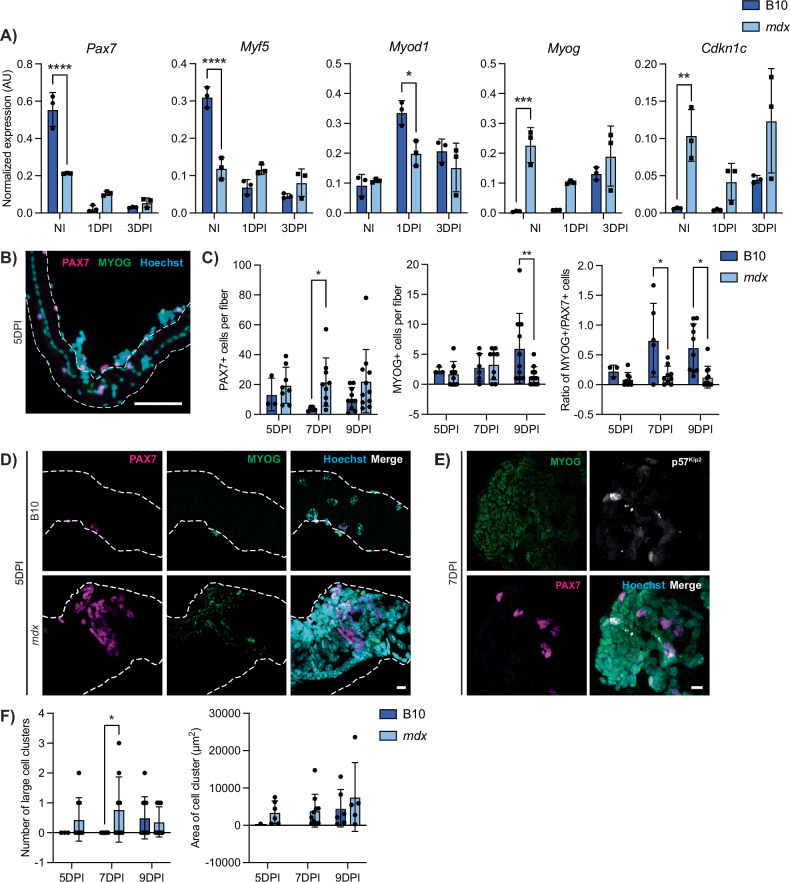
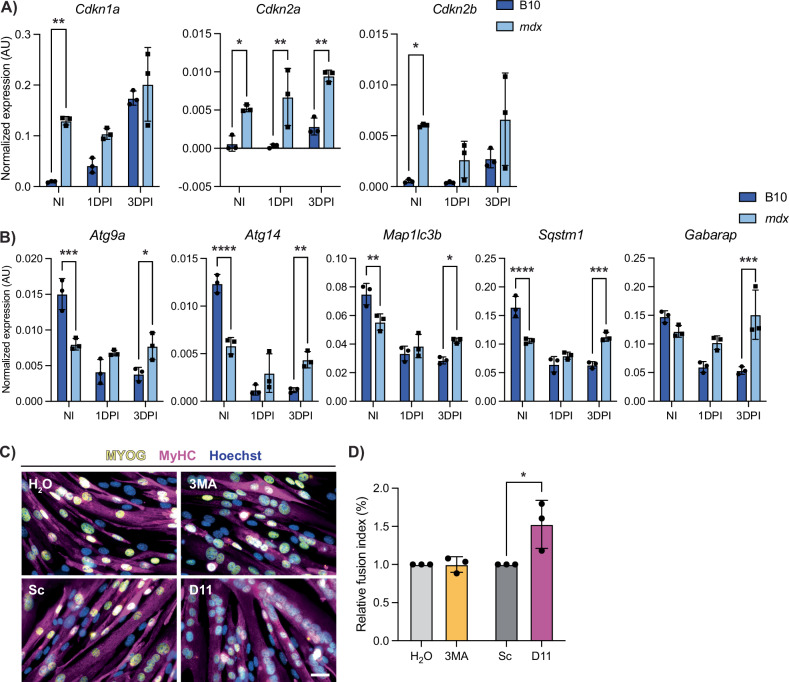
Satellite cells are muscle-resident stem cells that maintain and repair muscle. Increasing evidence supports the contributing role of satellite cells in Duchenne muscular dystrophy (DMD), a lethal degenerative muscle disease caused by loss of dystrophin. However, whether or not satellite cells exhibit dysfunction due to loss of dystrophin remains unresolved. Here, we used single-cell RNA-sequencing (scRNA-seq) to determine how dystrophin deficiency impacts the satellite cell transcriptome and cellular composition by comparing satellite cells from mdx and the more severe D2-mdx DMD mouse models. DMD satellite cells were disproportionally found within myogenic progenitor clusters and a previously uncharacterized DMD-enriched cluster. Despite exposure to different dystrophic environments, mdx and D2-mdx satellite cells exhibited overlapping dysregulation in gene expression and associated biological pathways. When comparing satellite stem cell versus myogenic progenitor populations, we identified unique dysfunctions between DMD and healthy satellite cells, including apoptotic cell death and senescence, respectively. Pseudotime analyses revealed differences in cell fate trajectories, indicating that DMD satellite cells are stalled in their differentiation capacity. In vivo regeneration assays confirmed that DMD satellite cells exhibit impaired myogenic gene expression and cell fate dynamics during regenerative myogenesis. These defects in differentiation capacity are accompanied by impaired senescence and autophagy dynamics. Finally, we demonstrate that inducing autophagy can rescue the differentiation of DMD progenitors. Our findings provide novel molecular evidence of satellite cell dysfunction in DMD, expanding on our understanding of their role in its pathology and suggesting pathways to target and enhance their regenerative capacity.


Conflict of interest statement

Competing interests: The authors declare no competing interests. Ethics approval and consent to participate: Approval for animal work was obtained from the McGill University Animal Care Committee (MCGL-8124). Housing, husbandry, and all experimental protocols for mice used in this study were performed in accordance with the guidelines established by the McGill University Animal Compliance Office, which is based on the guidelines of the Canadian Council on Animal Care.

Figures

Fig. 1
Fig. 1. Altered regenerative and satellite cell profiles in mdx and D2-mdx mice.
A H&E images from TA cross-sections of 3-month-old male DMD models (mdx and D2-mdx) and their respective controls (B10 and DBA), showing morphological changes in the DMD models such as centralized nuclei and changes in fiber cross-sectional area. B Quantification of fiber cross-sectional area, demonstrating changes in DMD models compared to controls. C Wheat germ agglutinin (WGA, green) and eMyHC (magenta) IF labeling of TA cross-sections showing regenerating injuries only in DMD models, which, as quantified in (D), show a significant increase in eMyHC+ fibers compared to controls. E Quantification of centrally nucleated fibers per mm2 of TA, showing a significant increase in mdx and D2-mdx compared to controls. F Representative IF labeling of TA cross-sections for WGA (green) and PAX7 (magenta), showing PAX7+ satellite cells (arrows). G Quantification of the number of PAX7+ cells per mm2 of TA, showing a significant increase in mdx and a decrease in D2-mdx compared to their respective controls. Scalebars = 50 µm (A, C) and 10 µm (F), *P < 0.05, **P < 0.01, ***P < 0.001, ****P < 0.0001 (two-tailed unpaired t-test, n = 4–7 biological replicates per strain). Data are expressed as frequency distribution (B) or mean ± SD (D, E, G).
Fig. 2
Fig. 2. Single-cell RNA-seq analysis of DMD satellite cells.
A UMAP representation after unsupervised clustering of myogenic cells showing the mapping of cells into seven distinct clusters. B Violin plot of highly expressed markers used to define the identity of each myogenic cluster. C Expanded violin plot of genes associated with satellite cell quiescence and activation for each satellite cell cluster (MuSC 1, 2, and 3). D Percentage of cells belonging to each cluster by strain, summarized in (E), showing a decrease in MuSC clusters and an increase in cycling, differentiating, and “DMD-enriched” clusters in the DMD models mdx and D2-mdx compared to their respective controls. F Violin plot of total RNA counts per cell for each myogenic cluster. G Feature plot of cell-cycle stage, showing that cycling progenitors are in G2M or S phase while MuSC 1, 2, 3, differentiating myocyte, and DMD-enriched cells are mainly in G1 phase.
Fig. 3
Fig. 3. Differential gene expression in DMD satellite cells.
A Principal component analysis (PCA) plot showing separation of DMD models versus healthy controls across PC1 and mouse genetic background on PC2. B Dot plot of the expression of genes which comprise the dystrophin-glycoprotein complex, showing decreased expression of all components except Sntb2 in DMD models vs respective controls. Volcano plots of differentially expressed genes in mdx versus B10 (C) and D2-mdx versus DBA (D). Venn diagram of upregulated (E) and downregulated (H) genes from mdx versus B10 (blue) and D2-mdx versus DBA (pink), and their overlap, and F, I heatmaps of the top 20 enriched terms, colored by p value, related to these gene lists. Circos plots representing the overlap between upregulated (G) and downregulated (J) gene lists. The outer circle represents the gene list for mdx (blue) and D2-mdx (red). The inner circle represents gene lists, where hits are arranged along the arc. Genes that hit multiple lists are colored in dark orange, and genes unique to a list are shown in light orange. Purple curves link identical genes between gene lists. Blue curves link genes that belong to the same enriched ontology term.
Fig. 4
Fig. 4. Apoptosis in DMD satellite cells and senescence in DMD myogenic progenitors.
A Selected terms related to apoptosis and senescence from the top 100 terms derived from differentially upregulated genes in mdx and D2-mdx satellite cells compared to controls. Dot plot of the expression of apoptosis and senescence GO terms comparing expression by B strain and by C cell cluster. D IF labeling of a cross-section of an mdx TA muscle for PAX7 (magenta) and TUNEL (yellow) showing a nucleus double positive for both PAX7 and TUNEL. E Quantification of number of nuclei that are PAX7 and TUNEL positive, visualized per mm2, showing their presence in DMD models only (n = 4–5 biological replicates). F Dot plot of scRNA-seq data showing an increase in senescence-associated genes Cdkn1a, Cdkn2a, and Cdkn2b in DMD models as compared to controls, and G verification of this increase in Cdkn1a, Cdkn2a, and Cdkn2b, with digital PCR from prospectively isolated satellite cells (n = 3 or 4 biological replicates as indicated). H SA-β-Gal (blue) and Hoechst (yellow) staining of TA cross-sections showing senescence in DMD models and I quantification of SA-β-Gal+ nuclei showing a significant increase in DMD muscle as compared to controls. J Strain comparison of the expression of autophagy-associated genes from satellite cells described in (G), showing reduced expression of autophagy genes in DMD models compared to healthy controls. Scalebars = 10 µm (D), 50 µm (H). *P < 0.05, **P < 0.01, ***P < 0.001, ****P < 0.0001 (two-tailed unpaired t-test (G, I, J), one-sided Fisher’s exact test (E)). Data are expressed as mean ± SD.
Fig. 5
Fig. 5. DMD MuSCs exhibit impaired myogenic differentiation.
A Dot plot of cell polarity genes and B canonical myogenic regulatory factors, and Cdkn1c from scRNA-seq data. C Digital PCR validation of myogenic regulatory factors and Cdkn1c from prospectively isolated satellite cells, showing lowered expression of early satellite cell factors like Pax7 and increased expression of late differentiation factors such as Myog. *P < 0.05, **P < 0.01, ****P < 0.0001 (two-tailed unpaired t-test). Data are expressed as mean ± SD. D Dot plot of scRNA-seq data for regulators of differentiation showing a decrease in pro-differentiation and an increase in anti-differentiation genes in DMD models compared to controls. E Pseudotime analysis of satellite cells showing cell fate trajectories with F three distinct cell fates, and G visualization by strain showing a preference for the “DMD-enriched” cluster fate in DMD compared to control satellite cells.
Fig. 6
Fig. 6. DMD satellite cells exhibit impaired in vivo regenerative myogenesis.
A Expression of myogenic factors and Cdkn1c in satellite cells from non-injured (NI), 1 day post-injury (1DPI), and 3-day post-injury (3DPI) showing dysregulation in mdx mice during myogenesis (P < 0.0001 for Pax7 and Myf5, P = 0.0496 for Myod1, P = 0.0028 for Myog, P = n.s. for Cdkn1c however strain factor P = 0.026). B Representative IF labeling of an mdx EDL myofiber isolated 5-day post-injury (5DPI) for PAX7 (magenta) and MYOG (green), showing myogenic cells along the fiber. C Quantification of PAX7+ and MYOG+ nuclei at 5, 7, and 9 DPI, showing more PAX7+ and less MYOG+ nuclei in mdx (Strain*DPI = n.s., strain factor P = 0.0124 for PAX7, P = 0.038 for MYOG). D Images of a B10 (top) and mdx (bottom) EDL myofiber isolated 5DPI and labeled for PAX7 (magenta) and MYOG (green), showing a myogenic cluster in the mdx myofiber. E A large myogenic cluster on an mdx EDL myofiber labeled for MYOG (green), PAX7 (magenta), and p57Kip2 (white) at 7DPI. F Quantification of the number of large clusters (>1000 µm2) and the area of these clusters. Scalebars = 100 µm (B), 10 µm (D, E). *P < 0.05, **P < 0.01, ***P < 0.001, ****P < 0.0001 (two-way ANOVA (A), two-tailed unpaired t-test (C, F)). Data are expressed as mean ± SD.
Fig. 7
Fig. 7. DMD satellite cells have impaired autophagy and senescence dynamics during regeneration.
A Digital PCR quantification of senescence-associated genes Cdkn1a, Cdkn2a, and Cdkn2b from non-injured (NI), 1 day post-injury (1 DPI) and 3 days post-injury (3DPI) B10 and mdx mice showing dysregulation in mdx (P > 0.05 for effect of strain*DPI, however P < 0.0001, P = 0.0134, and P = 0.0577 for effect of strain alone). B Digital PCR quantification of autophagy-associated genes in NI, 1 DPI, and 3 DPI B10 and mdx satellite cells demonstrating impaired autophagy dynamics in mdx cells during regeneration (Strain*DPI = P < 0.0001, < 0.0001, = 0.0007, < 0.0001, and = 0.0006, respectively). C Representative images of IF staining against MYOG (yellow) and MyHC (magenta) from mdx primary myoblasts treated with an autophagy inhibitor (3MA, 5 mM and H2O control) or autophagy inducer (Tat-D11, 10 µM and Scramble control) for 2 h prior to differentiation for 2 days. D Fusion index of each condition was determined and shows increased differentiation after Tat-D11 treatment. Scalebar = 25 µM, *P < 0.05, **P < 0.01, ***P < 0.001, ****P < 0.0001 (two-way analysis of variance (A, B) and two-tailed unpaired t-test (D)). Data are expressed as mean ± SD.

Similar articles

References

    1. Relaix F, Zammit PS. Satellite cells are essential for skeletal muscle regeneration: the cell on the edge returns centre stage. Development. 2012;139:2845–56. - PubMed
    1. Le Grand F, Rudnicki MA. Skeletal muscle satellite cells and adult myogenesis. Curr Opin Cell Biol. 2007;19:628–33. - PMC - PubMed
    1. Sambasivan R, Yao R, Kissenpfennig A, Van Wittenberghe L, Paldi A, Gayraud-Morel B, et al. Pax7-expressing satellite cells are indispensable for adult skeletal muscle regeneration. Development. 2011;138:3647–56. - PubMed
    1. Lepper C, Partridge TA, Fan C-M. An absolute requirement for Pax7-positive satellite cells in acute injury-induced skeletal muscle regeneration. Development. 2011;138:3639–46. - PMC - PubMed
    1. von Maltzahn J, Jones AE, Parks RJ, Rudnicki MA. Pax7 is critical for the normal function of satellite cells in adult skeletal muscle. Proc Natl Acad Sci USA. 2013;110:16474–9. - PMC - PubMed

MeSH terms

LinkOut - more resources