. 2025 Jun 5;16(1):5215.
doi: 10.1038/s41467-025-60476-z.

A gatekeeper sympathetic control of lacrimal tear secretion and dry eye onset through the NA-Adra1a-Ucp2 pathway

Affiliations

A gatekeeper sympathetic control of lacrimal tear secretion and dry eye onset through the NA-Adra1a-Ucp2 pathway

Mingli Qu et al. Nat Commun. .

Abstract

Tear secretion from the lacrimal gland is essential for maintaining ocular surface homeostasis, and its insufficiency causes aqueous-deficient dry eye. Unlike the well-established parasympathetic neuronal regulation, the role of sympathetic nervous system (SNS) in tear secretion remains controversial. Here, we demonstrate the intact sympathetic innervation in lacrimal gland and its activation under multiple dry eye stresses. Pharmacological, surgical, and genetic blockade of SNS increases tear secretion and alleviates dry eye signs. Mechanistically, SNS-driven noradrenaline (NA) release activates α1a-adrenergic receptor (Adra1a) in acinar and myoepithelial cells to regulate mitochondrial Ucp2 and tear secretion. Systemic and local delivery of Adra1a antagonists, including silodosin and tamsulosin, improves tear secretion and reduces corneal lesions in multiple dry eye mouse models. In addition, we identify the brain locus coeruleus as an upstream driver orchestrating sympathetic regulation of lacrimal secretion. Overall, these findings reveal a gatekeeper role of SNS in tear secretion and offer potential therapeutic strategies for dry eye disease.


Conflict of interest statement

Competing interests: A Chinese patent (ZL202210497086.8) has been granted to Eye Institute of Shandong First Medical University (Shandong Eye Institute, Qingdao Eye Hospital of Shandong First Medical University), with inventors Lixin Xie, Qingjun Zhou, Mingli Qu, and Sai Zhang. It covers the use of sympathetic activation inhibitors and/or α1-adrenergic receptor antagonists for treating dry eye. A related PCT application (PCT/CN2022/113244) is under examination. All other authors declare no competing interests.

Figures
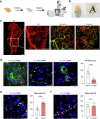
Fig. 1
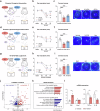
Fig. 1. Visualization of sympathetic nerves in mouse lacrimal gland.
a Schematic diagram of tissue clearing and fluorescence imaging. Created in BioRender. Wang, Q. (2025) https://BioRender.com/9ijvlqg. b Lacrimal gland before (left) and after (right) tissue clearing. c Representative images of immunolabeling by anti-TH with anti-CD31 and anti-Mist1. Scale bar, 200 μm. The experiment was repeated at least three times independently with a similar result. d Representative images of immunolabeling using anti-TH with anti-E-cadherin (ECAD), anti-aSMA and anti-Axna1. Distribution analysis of TH+ nerve fiber density in acinar and ductal area of lacrimal gland (n = 11 mice per group. P = 0.0006). Scale bar, 20 μm. e Representative image and quantitative analysis of immunolabeling using anti-TH and anti-choline acetyltransferase (ChAT) (n = 10 mice per group. P < 0.0001). Scale bar, 20 μm. f Representative image and quantitative analysis of immunolabeling using anti-TH and anti-synaptophysin (SYP) (n = 10 mice per group. P > 0.9999). Scale bar, 20 μm. All white arrows indicate TH-labeled sympathetic nerves. Data are shown as mean ± SEM. The significance of differences was detected using unpaired two-sided Student’s t test (df). ***P < 0.001, ns, not significant. Source data are provided as a Source Data file.
Fig. 2
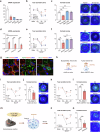
Fig. 2. Lacrimal SNS activation in response to dry eye stimuli.
a Schematic diagram of dry eye mouse model. Created in BioRender. Wang, Q. (2025) https://BioRender.com/vuq9hqj. Adult C57BL/6 J mice were treated with chronic desiccating stress and scopolamine injection (SCOP, 0.5 mg/0.2 ml, three times per day) for 7 days. b Changes of tear secretion (n = 8 mice per group. 3 d P = 0.0003, 7 d P < 0.0001). c Changes of corneal fluorescein staining (n = 8 mice per group. 3 d P = 0.0132, 7 d P < 0.0001). d Representative images of immunolabelling using anti-TH and anti-c-FOS and quantitative analysis of SCG neurons after 2 h of scopolamine injection (n = 6 mice per group. P < 0.0001). Scale bar, 50 μm. e Representative patch-clamp recording and quantification of action potential frequency of retrogradely-labeled SCG neurons from lacrimal gland after 2 h of scopolamine injection (Ctrl: n = 6 cells, SCOP: n = 8 cells. P = 0.0353). f NA (n = 5 mice per group. P = 0.0031) and ACh (n = 4 mice per group. P = 0.0251) concentrations of lacrimal glands. g Representative images of immunolabelling using anti-TH in lacrimal gland (n = 3 mice per group. P = 0.0151). Scale bar, 200 μm. h Quantitative PCR analysis (n = 3 mice per group. Ngf P = 0.0022, Gdnf P = 0.0046). Data are shown as mean ± SEM. The significance of differences was detected using unpaired two-sided Student’s t test (b, d, f, g, h), two-sided Mann-Whitney U test (e), and one-way ANOVA followed by Dunnett’s test (c), *P < 0.05, **P < 0.01, ***P < 0.001. Source data are provided as a Source Data file.
Fig. 3
Fig. 3. SNS inactivation increases tear secretion of dry eye mice.
a Schematic diagram of dry eye mice with 6-OHDA and SCGx treatment. Created in BioRender. Wang, Q. (2025) https://BioRender.com/xa8jatx. b Changes of tear secretion (n = 8 mice per group. 3 d 6-OHDA vs Vehicle P = 0.0501, SCGx vs Vehicle P = 0.0100, 7 d 6-OHDA vs Vehicle P = 0.0020, SCGx vs Vehicle P = 0.0001). c Changes of corneal fluorescein staining (n = 8 mice per group. 6-OHDA vs Vehicle P < 0.0001, SCGx vs Vehicle P < 0.0001). d Schematic diagram of Th-DTR mice treated with DT and wild type mice with guanethidine (Gua). Created in BioRender. Wang, Q. (2025) https://BioRender.com/57rh5q8. e Changes of tear secretion (n = 6 mice per group. 3 d Th-DTR vs Vehicle P = 0.0016, Gua vs Vehicle P = 0.0148, 7 d Th-DTR vs Vehicle P = 0.0033, Gua vs Vehicle P = 0.0154). f Changes of corneal fluorescein staining (n = 8 mice per group. Th-DTR vs Vehicle P < 0.0001, Gua vs Vehicle P = 0.0001). g Schematic diagram of 6-OHDA and scopolamine (SCOP)-pretreated mice with noradrenaline (NA) or Adra1 agonist A61603 infusion. Created in BioRender. Wang, Q. (2025) https://BioRender.com/50l00lu. h Changes of tear secretion (NaCl: n = 8 mice, NA or A61603: n = 6 mice, 3 d NA vs NaCl P = 0.0288, A61603 vs NaCl P = 0.0627, 7 d NA vs NaCl P = 0.0059, A61603 vs NaCl P = 0.0411). i Changes of corneal fluorescein staining (n = 8 mice per group. NA vs NaCl P = 0.0010, A61603 vs NaCl P = 0.0003). j Transcriptomic analysis. Six lacrimal glands from three mice were pooed as one sample, n = 3 samples per group. The significance of differential gene expression between two groups is assessed by the Wald test under the negative binomial distribution model. k KEGG analysis of the up-regulated and down-regulated genes, the method for calculating P values is based on the hypergeometric distribution. l Quantitative PCR analysis (n = 3 mice per group. Prb1 P = 0.0480, Amy1 P = 0.0199, TNF-α P = 0.0403, IL-1β P = 0.0482). Data are shown as mean ± SEM. The significance of differences was detected using one-way ANOVA followed by Dunnett’s test at each timepoint (b, c, e, f, h, i), and unpaired two-sided Student’s t test (l), *P < 0.05, **P < 0.01, ***P < 0.001, ns, not significant. Source data are provided as a Source Data file.
Fig. 4
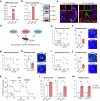
Fig. 4. Dominant role of Adra1a in SNS-controlled tear secretion.
a mRNA transcripts of adrenergic receptors in mouse lacrimal gland, n = 3 samples per group. b Changes of tear secretion (n = 4 mice per group. 3 d Tamsulosin vs Vehicle P = 0.0036, BMY7378 vs Vehicle P = 0.3396, Propranolol vs Vehicle P = 0.1924, 7 d Tamsulosin vs Vehicle P = 0.0008, BMY7378 vs Vehicle P = 0.8970, Propranolol vs Vehicle P = 0.8970). c Changes of corneal fluorescein staining (n = 5 mice per group. Tamsulosin vs Vehicle P < 0.0001, BMY7378 vs Vehicle P = 0.3304, Propranolol vs Vehicle P = 0.9642). d Verification of expression in the lacrimal gland of Adra1a, Adra1d, and Adrb2 heterozygous knockout mice (n = 3 mice per group. Adra1a P = 0.0012, Adra1d P = 0.0002, Adrb2 P = 0.0002). e Changes of tear secretion (n = 5 mice per group. 3 d WT vs Adra1a+/- P = 0.1578, Adra1d+/- vs Adra1a+/- P = 0.0773, Adrb2+/- vs Adra1a+/- P = 0.0243, 7 d WT vs Adra1a+/- P < 0.0001, Adra1d+/- vs Adra1a+/- P < 0.0001, Adrb2+/- vs Adra1a+/- P < 0.0001). f Changes of corneal fluorescein staining (n = 5 mice per group. WT vs Adra1a+/- P = 0.0059, Adra1d+/- vs Adra1a+/- P = 0.0059, Adrb2+/- vs Adra1a+/- P = 0.0023). g Representative images of immunolabeling using anti-Adra1a with anti-aSMA (myoepithelial cell marker), anti-AQP5 (acinar cell marker) and anti-Axna1 (ductal cell marker). Scale bars, 10 µm. The experiment was repeated at least three times independently with a similar result. h Schematic diagram of conditional knockdown in Acta2-cre and Mist1-creERT2 mice. Created in BioRender. Wang, Q. (2025) https://BioRender.com/9ivs458. i Changes of tear secretion (n = 5 mice per group. 3 d P = 0.0012, 7 d P < 0.0001). j Changes of corneal fluorescein staining (n = 6 mice per group. P = 0.0252). k Changes of tear secretion (n = 5 mice per group. 3 d P = 0.0018, 7 d P = 0.0032). l Changes of corneal fluorescein staining (n = 6 mice per group. P < 0.0001). m Schematic diagram of local silodosin delivery near lacrimal gland. Created in BioRender. Wang, Q. (2025) https://BioRender.com/q5tdk4d. n Changes of tear secretion (n = 8 mice per group. 3 d P < 0.0001, 7 d P < 0.0001). o Changes of corneal fluorescein staining (n = 8 mice per group. P = 0.0001). Data are shown as mean ± SEM. The significance of differences was detected using one-way ANOVA followed by Dunnett’s test at each timepoint (b, c, e, f), and unpaired two-sided Student’s t test (d, i, j, k, l, n, o), *P < 0.05, **P < 0.01, ***P < 0.001, ns, not significant. Source data are provided as a Source Data file.
Fig. 5
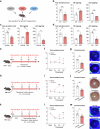
Fig. 5. SNS activation and effectiveness of Adra1 antagonist in multiple dry eye mice.
a Schematic diagram of TSP-1-/-, diabetic mellitus (DM) and restraint stress (RST)-induced dry eye mice. Created in BioRender. Wang, Q. (2025) https://BioRender.com/38dm4hu. b Tear secretion, lacrimal NA and ACh concentrations of TSP-1-/- mice (tear secretion: n = 8 mice, P = 0.0002. NA and ACh concentrations: n = 5 mice, NA P = 0.0241, ACh P < 0.0001). c Tear secretion, lacrimal NA and ACh concentrations of DM mice (tear secretion: n = 8 mice, P < 0.0001. NA concentrations: n = 5 mice, P = 0.0020. ACh concentrations: n = 4 mice, P = 0.0016). d Tear secretion, lacrimal NA and ACh concentrations of RST mice (tear secretion: n = 8 mice, P = 0.0073. NA concentrations: n = 5 mice, P = 0.0010. ACh concentrations: n = 4 mice, P = 0.0008). e Schematic diagram of Adra1 antagonist tamsulosin in TSP-1-/- mice. Created in BioRender. Wang, Q. (2025) https://BioRender.com/8074fye. f, Tear secretion of TSP-1-/- mice (n = 6 mice per group. 1w P = 0.9023, 3w P = 0.0445, 5w P = 0.0354). g Corneal fluorescein staining and scores of TSP-1-/- mice (n = 6 mice per group. P = 0.0048). h Schematic diagram of Adra1 antagonist tamsulosin in DM mice. Created in BioRender. Wang, Q. (2025) https://BioRender.com/mcpq7iu. i, Tear secretion of DM mice (n = 4 mice per group. 3 d P = 0.0758, 5 d P = 0.0003, 7 d P = 0.0020). j Corneal fluorescein staining and scores of DM mice (n = 6 mice per group. P = 0.0020). k Schematic diagram of Adra1 antagonist tamsulosin in RST mice. Created in BioRender. Wang, Q. (2025) https://BioRender.com/74k1x4r. l, Tear secretion of RST mice (n = 10 mice per group. 0 d P = 0.6622, 3 d P = 0.0303, 7 d P = 0.0087). m Corneal fluorescein staining and scores of RST mice (n = 10 mice per group. P = 0.0117). Data are mean ± SEM. The significance of differences was detected using unpaired two-sided Student’s t test (bd, f, g, i, j, l, m), *P < 0.05, **P < 0.01, ***P < 0.001. Source data are provided as a Source Data file.
Fig. 6
Fig. 6. Mediation of Ucp2 in SNS-controlled tear secretion.
a mRNA transcripts of Ucp1-3 in mouse lacrimal gland. (n = 3 samples per group. Ucp1 vs Ucp2 P < 0.0001, Ucp3 vs Ucp2 P < 0.0001). b Proteins of Ucp1-3 in mouse lacrimal gland. (β-actin was used as the Western blot loading control and n = 3 replications from three mice. Ucp1 vs Ucp2 P < 0.0001, Ucp3 vs Ucp2 P < 0.0001). c Representative images of immunolabeling using anti-Ucp2 with anti-aSMA (myoepithelial cell marker), anti-AQP5 (acinar cell marker). Scale bars, 10 µm. The experiment was repeated at least three times independently with a similar result. d Schematic diagram of dry eye mice with genipin treatment, Ucp2 knockout and Ucp2-interference AAV (shUcp2) injection into lacrimal gland. Created in BioRender. Wang, Q. (2025) https://BioRender.com/g5puhqp. e Changes of tear secretion (n = 4 mice per group. 7 d P = 0.0643, 9 d P = 0.0051, 11 d P = 0.0052). f Changes of corneal fluorescein staining (n = 4 mice per group. P < 0.0001). g Changes of tear secretion (n = 6 mice per group. 3 d P = 0.0346, 7 d P = 0.0001). h Changes of corneal fluorescein staining (n = 6 mice per group. P = 0.0010). i Changes of tear secretion (n = 5 mice per group. 3 d P = 0.0030, 7 d P = 0.0108). j Changes of corneal fluorescein staining (n = 5 mice per group. P < 0.0001). k, l Mitochondrial oxygen consumption rate (OCR) measurement and analysis. (n = 3 samples per group. Maximal Res, P = 0.0290, Spare Res, P = 0.0368). m mtDNA copy number analysis. (n = 3 samples per group. mt-ND1, P = 0.0099, mt-ND6, P = 0.0110). Data are shown as mean ± SEM. The significance of differences was detected using one-way ANOVA followed by Dunnett’s test at each timepoint (a, b), and unpaired two-sided Student’s t test (ej, l, m), *P < 0.05, **P < 0.01, ***P < 0.001, ns, not significant. Source data are provided as a Source Data file.
Fig. 7
Fig. 7. Involvement of brain locus coeruleus in the SNS-controlled tear reduction.
a Schematic diagram of retrograde trans-synaptic tracing and representative images of RFP signals in locus coeruleus (LC) and GFP signals in superior salivatory nucleus (SSN). Created in BioRender. Wang, Q. (2025) https://BioRender.com/a9nx90z. Scale bar, 100 μm. The experiment was repeated at least three times independently with a similar result. b, c Representative images and quantitative analysis of c-FOS+TH+ neurons in LC and c-FOS+ChAT+ neurons in SSN (n = 4 mice per group. LC P = 0.0050, SSN P < 0.0001). Scale bar, 100 μm. d Representative trace of patch-clamp recording and quantification of action potential frequency under 60 pA current injection for LC neurons in the SCOP-treated mice and vehicle mice (Ctrl: n = 6 cells, SCOP: n = 5 cells. P = 0.0476). e Schematic diagram of chemogenetic inhibition in LC of Th-cre mice. Created in BioRender. Wang, Q. (2025) https://BioRender.com/ntcf4so. f Representative images and quantitative analysis of c-FOS+TH+ neurons in LC after chemogenetic manipulation (n = 5 mice per group. P < 0.0001). Scale bar, 100 μm. g In vivo electrophysiological recordings of LC neurons in scopolamine-treated hM4Di expressing mice after CNO or NaCl injection. Representative example rasters (upper panel) and rate histogram (lower panel) of LC neurons in mice treated with CNO or NaCl. h Tear secretion of scopolamine-treated hM4Di expressing mice with CNO or NaCl injection (n = 10 eyes per group. P < 0.0001). i Schematic diagram of optogenetic manipulation of LC neurons in Th-cre mice. Created in BioRender. Wang, Q. (2025) https://BioRender.com/mz65rvu. j Neuronal identification of AAV9-EF1a-DIO-eNpHR3.0-EYFP in Th-cre mice. The LC noradrenergic neurons (TH) labeled by AAVs (EYFP). Scale bar, 100 μm. The experiment was repeated at least three times independently with a similar result. k Tear secretion of Th-cre mice after LC optogenetic manipulation by injecting AAV9-EF1a-DIO-eNpHR3.0-EYFP and control virus (EGFP: n = 6 eyes, eNpHR3.0: n = 8 eyes. 10 min P = 0.7374, 20 min P = 0.0003, 30 min P = 0.0005, 40 min P = 0.3973). The yellow area denotes the inhibition period. Data are shown as mean ± SEM. The significance of differences was detected using unpaired two-sided Student’s t test (c, f, h, k) or two-sided Mann-Whitney U test (d) *P < 0.05, **P < 0.01, ***P < 0.001. Source data are provided as a Source Data file.
Fig. 8
Fig. 8. Reflex tear secretion with SNS activation and inhibition.
a Schematic diagram of brain LC activation by AAV9-hSyn-DIO-hM3Dq-EGFP injection in LC of Th-cre mice. Created in BioRender. Wang, Q. (2025) https://BioRender.com/bv59m6f. b Representative images and quantitative analysis of c-FOS+TH+ neurons in LC after chemogenetic manipulation (n = 5 mice per group, P < 0.0001). Scale bar, 100 μm. c In vivo electrophysiological recordings of LC neurons in hM3Dq mice. Representative roster trace (upper panel) and rate histogram (lower panel) of LC neurons in mice 1 hour after CNO or NaCl injection. d Dynamics of reflex tear secretion after corneal irritation with nylon thread (hM3Dq-NaCl: n = 8 eyes, hM3Dq-CNO: n = 12 eyes. 0 min P = 0.0028, 1 min P = 0.0049, 3 min P = 0.0905). e Dynamics of reflex tear secretion after carbachol treatment (hM3Dq-NaCl: n = 8 eyes, hM3Dq-CNO: n = 11 eyes. 8 min P = 0.0446, 15 min P = 0.0088, 45 min P = 0.3172, 60 min P = 0.7816). f Schematic diagram of SNS ablation by superior cervical sympathectomy (SCGx). Created in BioRender. Wang, Q. (2025) https://BioRender.com/numw4qn. g Dynamics of reflex tear secretion after corneal irritation with nylon thread (n = 4 mice per group, 0 min P = 0.0397, 1 min P = 0.8128, 3 min P = 0.8896). h Dynamics of stimulated tear secretion after carbachol treatment (n = 6 mice per group, 15 min P = 0.4523, 30 min P = 0.0046, 60 min P = 0.8350). Data are shown as mean ± SEM. The significance of differences was detected using unpaired two-sided Student’s t test (b, d, e, g, h), *P < 0.05, **P < 0.01, ***P < 0.001. Source data are provided as a Source Data file.
Fig. 9
Fig. 9. Schematic diagram of neural controlled tear secretion from lacrimal gland.
Brain locus coeruleus (LC) and superior salivatory nucleus (SSN) represent the central noradrenergic and cholinergic neural nucleus projecting to lacrimal gland via the superior cervical ganglion (SCG) and pterygopalatine ganglion (PG). They release the noradrenaline (NA) and acetylcholine (ACh) that binds to the Adra1a and M3AChR receptors in the acinar and myoepithelial cells of lacrimal gland. The balanced orchestration of sympathetic nervous system (SNS) and parasympathetic nervous system (PSNS) precisely controls tear production and secretion from lacrimal gland. Dry eye stress causes SNS activation of lacrimal gland, which reduces tear production and secretion through the NA-Adra1a-UCPs signaling pathway. Corneal irritation and carbachol injection causes PSNS activation, which evokes reflex tear hypersecretion and can be reversed by SNS activation. Created in BioRender. Wang, Q. (2025) https://BioRender.com/229xwx3.

Similar articles

References

    1. Zhou, L. & Beuerman, R. W. Tear analysis in ocular surface diseases. Prog. Retin. Eye Res.31, 527–550 (2012). - PubMed
    1. Ohashi, Y., Dogru, M. & Tsubota, K. Laboratory findings in tear fluid analysis. Clin. Chim. Acta369, 17–28 (2006). - PubMed
    1. Willcox, M. D. P. et al. TFOS DEWS II tear film report. Ocul. Surf.15, 366–403 (2017). - PMC - PubMed
    1. Pflugfelder, S. C. & Stern, M. E. Biological functions of tear film. Exp. Eye Res.197, 108115 (2020). - PMC - PubMed
    1. Rattner, A., Heng, J. S., Winer, B. L., Goff, L. A. & Nathans, J. Normal and Sjögren’s syndrome models of the murine lacrimal gland studied at single-cell resolution. Proc. Natl Acad. Sci. USA120, e2311983120 (2023). - PMC - PubMed

MeSH terms

Substances

LinkOut - more resources