Clinical Trial
. 2025 Jun 5;16(1):5214.
doi: 10.1038/s41467-025-60394-0.

A phase I/II trial of WT1-specific TCR gene therapy for patients with acute myeloid leukemia and active disease post-allogeneic hematopoietic cell transplantation: skewing towards NK-like phenotype impairs T cell function and persistence

Affiliations
Clinical Trial

A phase I/II trial of WT1-specific TCR gene therapy for patients with acute myeloid leukemia and active disease post-allogeneic hematopoietic cell transplantation: skewing towards NK-like phenotype impairs T cell function and persistence

Francesco Mazziotta et al. Nat Commun. .

Abstract

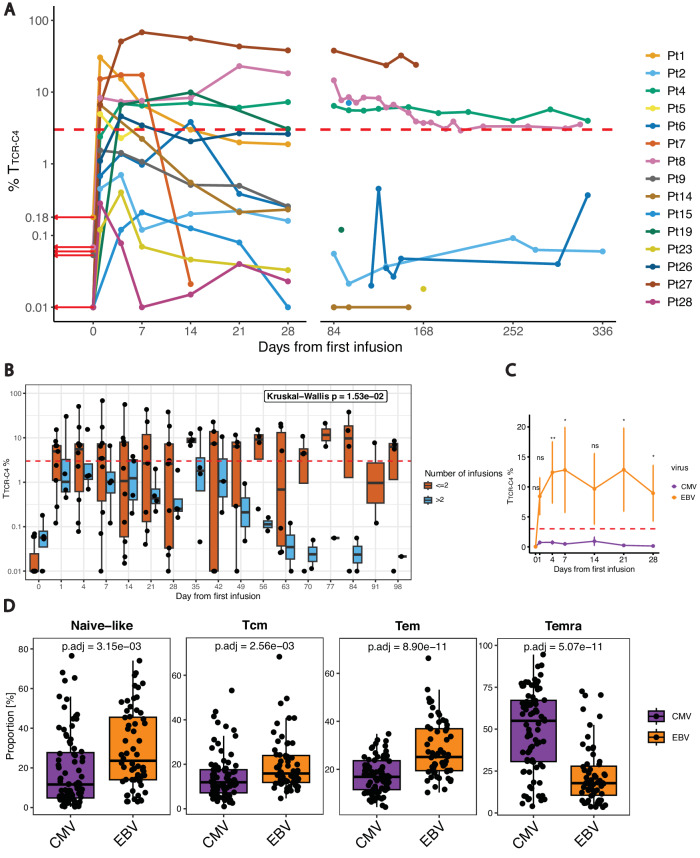
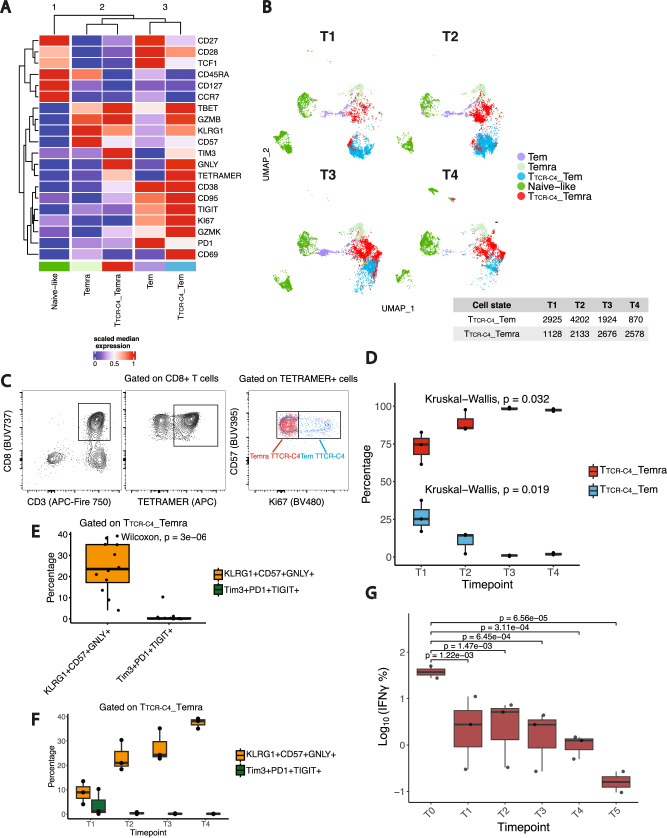
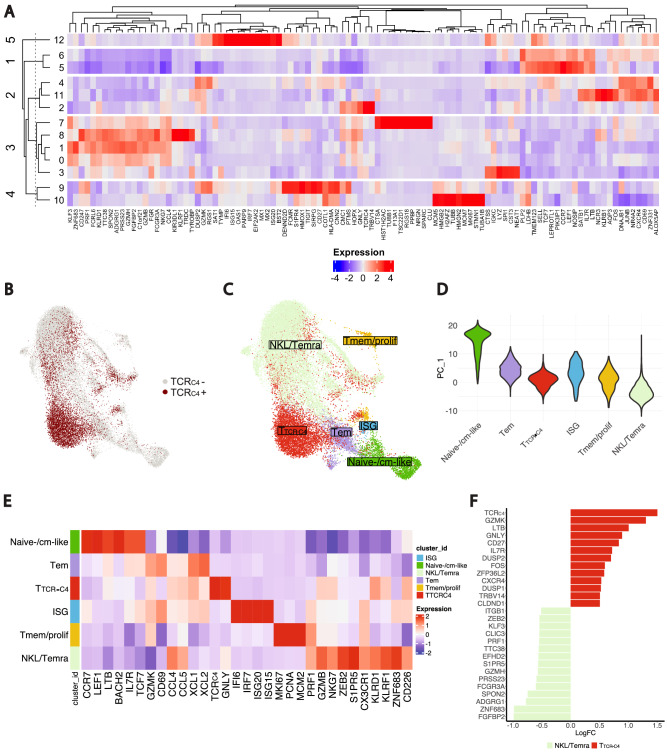
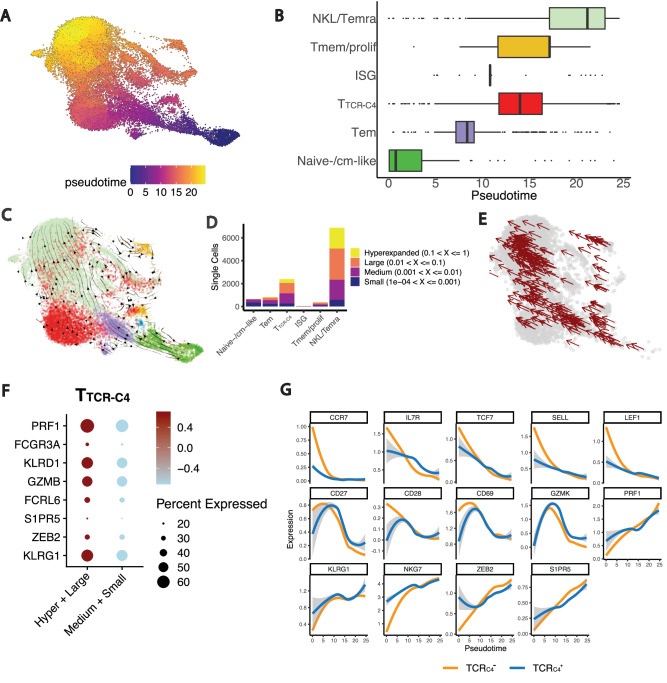
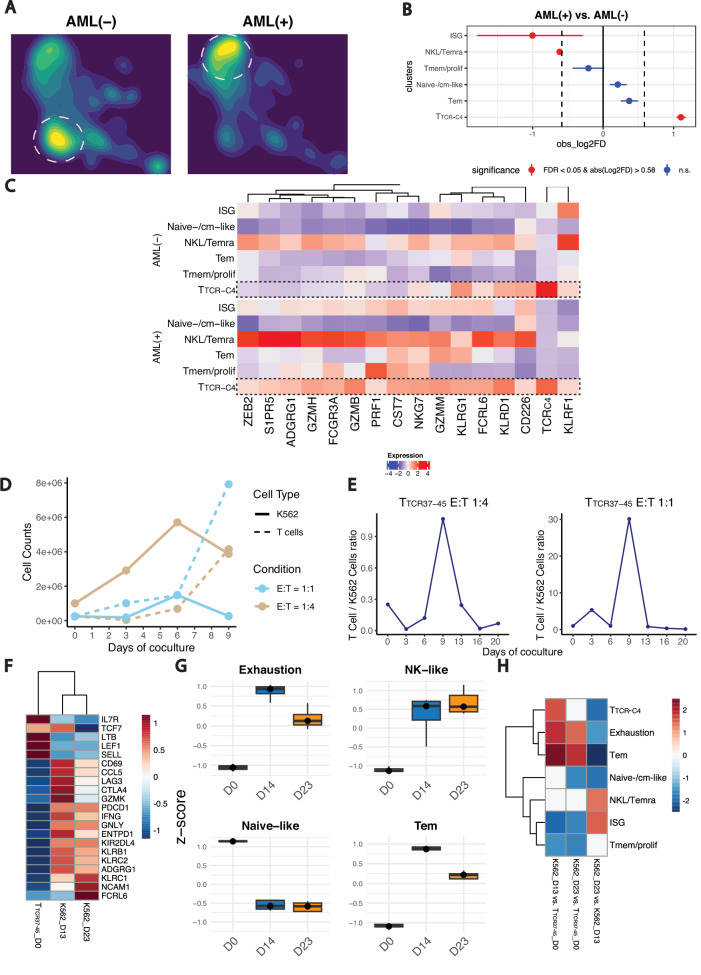
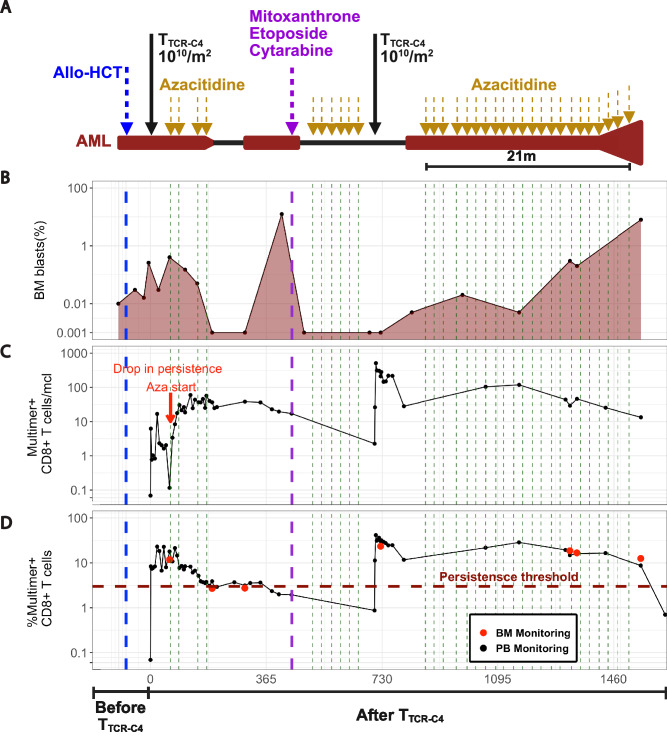
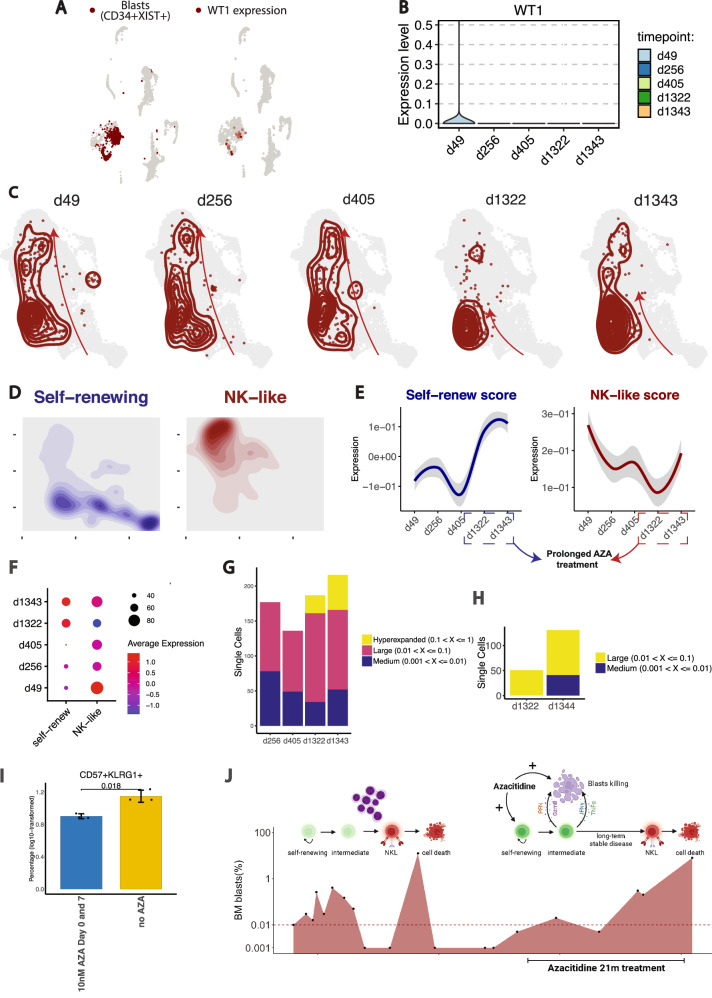
Relapsed and/or refractory acute myeloid leukemia (AML) post-allogeneic hematopoietic cell transplantation (HCT) is usually fatal. We previously reported that post-HCT immunotherapy with Epstein-Barr virus (EBV)-specific donor CD8+ T cells engineered to express a Wilms Tumor Antigen 1-specific T-cell receptor (TTCR-C4) appeared to prevent relapse in high-risk patients. In this phase I/II clinical trial (NCT01640301), we evaluated safety (primary endpoint), persistence and efficacy (secondary endpoints) of EBV- or Cytomegalovirus (CMV)-specific TTCR-C4 in fifteen patients with active AML post-HCT. Infusions were well tolerated, with no dose-limiting toxicities or serious adverse events related to the product. However, TTCR-C4 cells did not clearly improve outcomes despite EBV-specific TTCR-C4 cells showing enhanced potential for prolonged persistence compared to CMV-specific TTCR-C4. Investigating the fate of persisting TTCR-C4, we identified a shift towards natural killer-like (NKL) terminal differentiation, distinct from solid tumor-associated canonical exhaustion programs. In one patient, treatment with azacitidine appeared to mitigate this NKL skewing, promoting TTCR-C4 persistence. These findings suggest that AML drives a distinct form of T-cell dysfunction, highlight the need for targeted approaches that preserve T-cell fitness, ultimately improving the efficacy of cellular therapies for AML.


Conflict of interest statement

Competing interests: A.G.C. has received support from Juno Therapeutics, Lonza, and Affini-T. P.D.G. is a consultant, has received support from and has had ownership interest in Juno Therapeutics and Affini-T Therapeutics. He has also received support from Lonza, and consults and has ownership interest in Rapt Therapeutics, Elpiscience, Immunoscape, Earli, Metagenomi. Catalia, and Nextech. P.D.G., T.M.S., and the Fred Hutchinson Cancer Research Center have intellectual property related to TCRC4. A.G.C. and K.G.P. have received reagents from 10X Genomics. R.G. has received consulting income from Takeda, Arcellx and Sanofi, and declares ownership in Ozette Technologies. CJW receives equity from BionTech, and is a SAB member of Repertoire, Adventris, Aethon Therapeutics and Nature’s Toolbox. M.B. is employed at Bristol Myers Squibb. The remaining authors declare no competing interests.

Figures

Fig. 1
Fig. 1. Virus-dependent terminal differentiation skewing of TTCR-C4.
A Line plot showing the percentage (log scale, y-axis) of TTCR-C4 in PBMCs after the first TTCR-C4 infusion for all patients (n = 15). Data points represent individual samples at different timepoints post-infusion. Each patient is represented by a distinct color. Red arrows indicate WT1-specific CD8+ T cells percentages at day 0. B Boxplots comparing TTCR-C4 percentages (log scale, y-axis) post-first infusion (x-axis) in all patients (n = 15), colored by the number of infusions (light blue: ≤2; dark orange: > 2). The dashed red line indicates the 3% threshold used to define persisting TTCR-C4 cells. Statistical significance was determined using Kruskal-Wallis test, with p < 0.05 considered significant. Boxplots show the interquartile range (IQR); lines denote medians. The bounds of the box represent the 25th and 75th percentiles; whiskers span 1.5x IQR. C Line plot of TTCR-C4 percentages (y-axis) derived from EBV- (dark orange) or CMV-specific (dark violet) substrate cells over a 28-day period (x-axis) post-first infusion (n = 15). Error bars indicate mean ± standard error of the mean. Statistical significance was determined using a two-sided Wilcoxon Rank Sum test. (* p < 0.05, ** p < 0.01). Significant differences were observed at days 4 (p = 0.00699), 7 (p = 0.012), 21 (p = 0.0303), and 28 (p = 0.0295). D Boxplots showing differential abundance analysis of CMV-specific (dark violet) and EBV-specific (dark orange) CD8+ T-cell subsets derived from the analysis of mass cytometry data (n = 143). CD8+ T-cell subsets are defined based on marker co-expression showed in Supplementary Fig. 8B. Differential abundance between conditions (CMV vs. EBV) was computed using the edgeR method within the diffcyt framework. P-values were adjusted for multiple testing using the Benjamini-Hochberg procedure. Adjusted p-values (threshold for significance of p < 0.05) are displayed above each comparison. Boxplots show the IQR; lines denote medians. The bounds of the box represent the 25th and 75th percentiles; whiskers span 1.5x IQR.
Fig. 2
Fig. 2. CD8+ T cell subset phenotypes and functional states over time.
A Heatmap of fluorescence intensity for 20 markers across Naïve-like, Tem, TTCR-C4_Tem (tetramer+), Temra, TTCR-C4_Temra (tetramer+) PB CD8+ T cells. Median expression values are highlighted (red = high, blue = low). Data were scaled post-aggregation to highlight population-level differences between tetramer+ and tetramer- samples. K-means algorithm categorized clusters by similarity into three groups (1-3, top of heatmap). Data were derived from spectral flow-cytometry. B UMAP plots of the CD8+ T-cell subsets, colored by subset and split by timepoint. The table shows the absolute numbers of TTCR-C4_Tem and TTCR-C4_Temra cells at timepoints T1-T4. C Contour plots illustrating the gating strategy for TTCR-C4_Tem (blue) and TTCR-C4_Temra (red): CD3+CD8+ were first gated, followed by selection of tetramer+ cells, and finally separation based on Ki67 expression: Ki67+ (TTCR-C4_Tem, blue) and Ki67- (TTCR-C4_Temra, red) cells. This strategy was based on marker expression in Fig. 2A. D Boxplots of TTCR-C4_Tem and TTCR-C4_Temra percentages over time (T1-T4, n = 3). Statistical significance was assessed using Kruskal-Wallis test. Boxplots show the IQR; lines denote medians. The bounds of the box represent the 25th and 75th percentiles; whiskers span 1.5x IQR. E Boxplots showing cytotoxic (KLRG1+, CD57+, GNLY+; dark red) vs. exhausted (TIM3+, PD1+, TIGIT+; blue) T cells among TTCR-C4_Temra (n = 3). Statistical significance was assessed using a two-sided Wilcoxon rank-sum test. Boxplots show the IQR; lines denote medians. The bounds of the box represent the 25th and 75th percentiles; whiskers span 1.5x IQR. F Boxplots displaying cytotoxic (dark red) vs. exhausted (blue) T cells among TTCR-C4_Temra over time (T1-T4, n = 3). Boxplots show the IQR; lines denote medians. The bounds of the box represent the 25th and 75th percentiles; whiskers span 1.5x IQR. G Boxplots showing log10-transformed percentages of TTCR-C4 IFNγ+ cells within the CD8+ population following WT1-peptide stimulation across timepoints post-first infusion (n = 3, Supplementary Table 6). A linear mixed-effects model assessed the effect of Timepoint (T0 as intercept) on IFNγ production, with a two-sided hypothesis test. Boxplots show the IQR; lines denote medians. The bounds of the box represent the 25th and 75th percentiles; whiskers span 1.5x IQR.
Fig. 3
Fig. 3. Single cell transcriptomic analysis of endogenous and TTCR-C4 CD8+ T-cell states and their differentiation dynamics.
A Heatmap showing the top 10 differentially expressed genes per cluster. The “top 10” refers to the 10 genes with the most significant differential expression across the identified clusters. The dendrogram on the left displays the similarity between the 13 clusters, which were determined through unsupervised clustering based on gene co-expression patterns. The top dendrogram shows the relationships between the genes based on their expression patterns. K-means algorithm grouped the 13 clusters into 5 main categories, labeled 1 to 5 on the left side of the heatmap. Blue indicates low expression; red, high. B UMAP plot of the CD8+ T cells (endogenous and TTCR-C4+) on a two-dimensional space. TTCR-C4+ cells were identified using scGate, an R package which scores cells based on TCRC4 expression and defines thresholds to classify cells as positive or negative for the population of interest. TCRC4+ cells are colored in dark red, while TCRC4- cells (endogenous) are represented in light gray. C UMAP plot displaying the two-dimensional distribution of annotated CD8+ T-cell transcriptional states, colored by subset. D Violin plot illustrating the distribution of CD8+ T-cell subsets identified through gene expression (Fig. 3A) and TCRC4 score (Fig. 3B) along the principal component 1 (PC_1) axis. Each violin represents a different CD8+ T-cell state. The proximity of each subset along PC_1 (y-axis) indicates transcriptional similarity, with subsets closer together showing more similar gene expression profiles. E Heatmap showing the differential expression of manually curated genes across the five annotated CD8+ T-cell subsets. Blue and red indicate the relative expression levels of each marker within each subset, with blue representing lower expression and red indicating higher expression. F Bar plot showing differential gene expression analysis comparing TTCR-C4 and NKL/Temra (TTCR-C4-) CD8+ T cells. Differential expression was performed using a two-sided Wilcoxon rank-sum test implemented in the Seurat package. P-values were adjusted for multiple testing using the Bonferroni correction. Genes with an adjusted p-value (padj) <0.01 and log2 fold change (logFC) > 0.5 or < −0.5 were included. Bars represent log2 fold change values, with red indicating genes upregulated in TTCR-C4 and green representing genes upregulated in NKL/Temra.
Fig. 4
Fig. 4. CD8+ T-cell differentiation dynamics and clonal expansion.
A UMAP plot illustrating the developmental trajectory of CD8+ T-cell transcriptional states, as predicted by Monocle. The color scale represents the pseudotime, where blue indicates earlier developmental stages and orange/yellow indicates later stages. B Boxplots showing the distribution of the 5 CD8+ T-cell subsets (y-axis) along the pseudotime (x-axis). The position of the boxes provides context for how the subsets are positioned within the developmental trajectory, with subsets at lower pseudotime values representing earlier stages of differentiation, while those at higher pseudotime values correspond to later stages. Boxplots show the IQR; lines denote medians. The bounds of the box represent the 25th and 75th percentiles; whiskers span 1.5x IQR. C UMAP plot colored by the annotated CD8+ subsets overlaid with the predicted velocity stream computed through scVelo. The velocity streams represent the predicted direction and magnitude of gene expression changes for each individual cell, providing insights into the dynamic transitions between cellular states. These streams highlight the likely trajectories cells follow as they evolve over time, offering a predictive view of future cellular states based on current transcriptional dynamics. D Stacked bar plot showing cell count of different T-cell states (x-axis) in specific clonal frequency ranges. Colors indicate the clonal frequencies. E UMAP visualization of hyperexpanded and large CD8+ T cell clones, defined in (D), showing shared TCR sequences across different clusters. Each point represents a single cell, while arrows indicate the inferred directionality of clonal expansion across clusters. F Dot plot showing the expression of NKL genes in TTCR-C4 with a higher degree of clonal expansion (Hyperexpanded, large) vs. less clonally expanded TTCR-C4 (Medium, small). Clonal frequency ranges are defined in (D). G Line plots displaying the smoothed gene expression of selected genes along the pseudotime for TCRC4- (orange) and TCRC4+ (blue) cells. These plots illustrate the dynamic changes in gene expression (y-axis) as cells progress along the inferred trajectory (x-axis). The smoothed curves show how the expression of each gene varies at different pseudotime points.
Fig. 5
Fig. 5. AML induces TTCR-C4 NKL/Temra differentiation skewing.
A UMAP plot of CD8+ T cells colored by density and split by group (AML(-) and AML( + )). AML(+) samples are those with detectable leukemic cells in BM or PB, while AML(-) lack detectable disease. Color intensity reflects CD8+ T-cell density (blue = low, yellow = high). Dashed lines highlight areas of highest density in each group. B Point-range plot showing the pairwise (AML(+) vs. AML(-)) proportional difference for each CD8+ T-cell subset. Horizontal lines extending from each point denote the 95% confidence intervals of the log2FD. Colors indicate the statistical significance (red: FDR < 0.05, blue: FDR ≥ 0.05); vertical dashed lines mark the absolute value of log2FD cutoff for significance. C Heatmap displaying DGE of NKL genes across the CD8+ T-cell subsets in AML(-) vs. AML(+) (blue = low, red = high expression). Dashed boxes highlight NKL/Temra genes. D Line plots showing the absolute cell counts over time (days of coculture) for TTCR37-45 (dashed lines) and K562 cells (solid lines) at E:T ratios of 1:1 (sky blue) and 1:4 (tan). E Line plots showing the T-cell-to-tumor-cell ratio over time for each E:T condition (left: 1:4; right: 1:1). Cell ratios were calculated based on flow cytometry data. F Heatmap depicting significant DEGs across TTCR37-45_D0 (TTCR37-45-only), K562_D13 (TTCR37-45 T cells after 13 days of coculture with K562 AML cell line), K562_D23 (TTCR37-45 T cells after 23 days of coculture with K562 AML cell line) conditions. Signifcance was determined using DESeq2 (FDR < 0.05). Blue = low, red = high expression. G Boxplots illustrating the z-score of Exhaustion, NK-like, Naïve-like and Tem signatures aross co-culture timepoints. Each box represents the distribution of z-scores for the genes in the respective signature at each timepoint. The center line indicates the median; the box limits represents the IQR, and the whiskers span 1.5 x IQR. H Heatmap illustrating the enrichment of the top 50 DEGs from scRNAseq-derived subsets (TTCR-C4, Tem, Naïve-/cm-like, NKL/Temra, ISG, Tmem/prolif) and manually curated exhaustion markers across three comparisons: K562_D13 vs. TTCR37-45_D0, K562_D23 vs. TTCR37-45_D0, K562_D23 vs. K562_D13. Red = high, blue = low enrichment. TTCR37-45 represents the baseline (TTCR37-45-only condition).
Fig. 6
Fig. 6. Timeline and disease response in a patient with relapsed AML post-allogeneic HCT treated with TTCR-C4 and Azacitidine.
A Timeline of patient’s treatment regimen. Dark red highlights timeframes with detectable BM AML B Percent of BM AML blasts (y-axis, log scale) by multiparametric flow cytometry (MFC) at specific timepoints (black dots, dark red shaded area). C Multimer+ cells/µl and D Percent multimer+ of CD8+ T cells in PB (black dots) and BM (red dots) collected before and after TTCR-C4 infusions. The red arrow indicates the lack of TTCR-C4 persistence before the start of Azacitidine.
Fig. 7
Fig. 7. Longitudinal single-sell analysis of TTCR-C4 transcriptional skewing and clonal evolution in a patient with relapsed AML post-allogeneic HCT.
A UMAP plots showing a blast score calculated from CD34 and XIST (female-specific) co-expression in a patient treated with a sex-mismatched transplant (female patient, male donor), along with WT1 expression. Cells with high scores are in dark red. B Violin plot of the WT1 expression across timepoints post-TTCR-C4 infusion (d49, d256, d405, d1322, d1343). C UMAP plots of PB CD8+ T cells from the scRNAseq dataset, with the TTCR-C4 subset from patient 8 highlighted (dark red). Kernel density contours depict the density of TTCR-C4 cells within the CD8+ T cell landscape at each timepoint (d49, d256, d405, d1322, and d1343). Arrows were added manually to indicate the different skewing of TTCR-C4 across the timepoints examined. D UMAP plots of PB CD8+ T cells, with density contours highlighting cells with high (above 75th percentile) self-renewing (TCF7, LEF1, SELL, CCR7, BCL2, IL7R, CD27, CD28; blue) and NK-like (ZEB2, S1PR5, CX3CR1, KLRG1, NKG7, FCRL6, KLRD1, ADGRG1; red) gene scores. E Line plots showing the temporal changes in the self-renew (left) and NK-like (right) scores of TTCR-C4. The blue (self-renew) and dark red (NK-like) lines represent LOESS-smoothed means of the scores, with shaded areas indicating the 95% confidence interval. The y-axis reflects score expression values. F Dot plot showing the self-renew and NK-like scores of TTCR-C4 across timepoints post-infusion. G Stacked bar plot showing cell count of PB TTCR-C4 within specific clonal frequency ranges over time (d256, d405, d1322, d1343). Colors indicate the clonal frequencies. H Stacked bar plot showing cell count of BM TTCR-C4 within specific clonal frequency ranges at d1322 and d1343. Colors indicate the clonal frequencies. I Bar plot illustrating the log10-transformed percentage of CD57+KLRG1+ TTCR-C4 after CD3/CD28 stimulation ± 10 nM AZA. Data are presented as mean ± standard deviation (n = 6, 3 biological replicates/condition). Two-sided Welch’s t-test was used for statistical testing, assuming unequal variances between groups. J Cartoon showing the influence of blasts and azacitidine on TTCR-C4. The red area under the curve represents the blasts percentage over time. Blasts induce TTCR-C4 skewing towards NKL and cell death; azacitidine supports self-renewal and long-term persistence. Created in BioRender. Mazziotta, F. (https://BioRender.com/twt3jx5).

Similar articles

Cited by

References

    1. Bejanyan, N. et al. Survival of patients with acute myeloid leukemia relapsing after allogeneic hematopoietic cell transplantation: a center for international blood and marrow transplant research study. Biol. Blood Marrow Transpl.21, 454–459 (2015). - PMC - PubMed
    1. Schmid, C. et al. Treatment, risk factors, and outcome of adults with relapsed AML after reduced intensity conditioning for allogeneic stem cell transplantation. Blood119, 1599–1606 (2012). - PubMed
    1. Webster, J. A., Luznik, L. & Gojo, I. Treatment of AML Relapse After Allo-HCT. Front Oncol.11, 812207 (2021). - PMC - PubMed
    1. Cobbold, M. et al. Adoptive transfer of cytomegalovirus-specific CTL to stem cell transplant patients after selection by HLA-peptide tetramers. J. Exp. Med202, 379–386 (2005). - PMC - PubMed
    1. Haque, T. et al. Complete regression of posttransplant lymphoproliferative disease using partially HLA-matched Epstein Barr virus-specific cytotoxic T cells. Transplantation72, 1399–1402 (2001). - PubMed

Publication types

MeSH terms