. 2025 Jun 5;16(1):5239.
doi: 10.1038/s41467-025-60414-z.

Stimulus-specific and adaptive value representations in the basolateral amygdala in male mice

Affiliations

Stimulus-specific and adaptive value representations in the basolateral amygdala in male mice

Julian Hinz et al. Nat Commun. .

Abstract

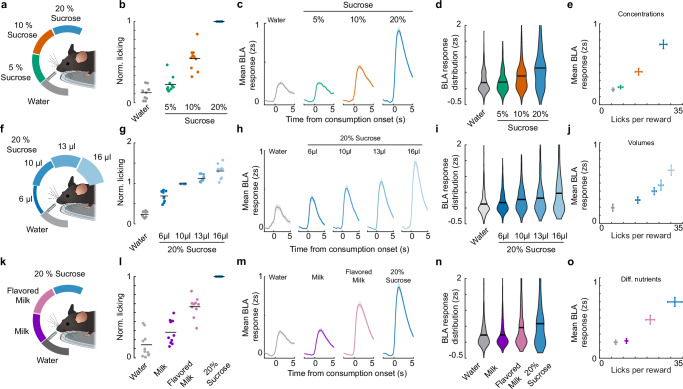
Animals make decisions based on the value of potential outcomes. This perceived value is not fixed; it changes depending on internal needs, such as hunger or thirst, and past experiences. The basolateral amygdala (BLA) is known to be crucial for updating predicted reward values. However, it has been unclear how the BLA represents the specific value of different rewards. Two-photon calcium imaging in male mice showed that population response magnitude scaled with subjective value, and different rewards recruited distinct neuronal subpopulations. Value representations quickly re-scaled when a novel, higher-value reward appeared, and internal state shaped them: thirst selectively boosted responses to water, whereas aversive experience dampened sucrose responses. Thus, BLA circuits carry flexible, stimulus-specific value signals that integrate relative value and current affective or homeostatic conditions, providing a neural basis for adaptive decision making and learning. Our findings reveal that the BLA maintains adaptable, reward-specific value signals, essential for guiding choices according to current needs and changing circumstances.


Conflict of interest statement

Competing interests: The authors declare no competing interests.

Figures

Fig. 1
Fig. 1. BLA activity is locked to reward consumption onset.
a Schema of recorded variables during head-fixed behavioral paradigm with random reward deliveries. b Example licking from three animals consuming water and 20% sucrose rewards. c Lick pattern surrounding the first consummatory lick (n = 10 (animals) - sessions = 4). d Mean lick probability following consumption onset. e Mean number of uninterrupted licks (inter-lick interval <500 ms) following consumption onset for the different rewards (paired t-test, p = 0.0044, n = 10 (animals) − sessions = 4). f Example tongue tip trajectories during unrewarded licks as well as consummatory lick bouts whilst consuming water and sucrose 20%. Single interpolated lick trajectories with average trajectory overlaid. g Left: matrix comparing the procrustes distance of different lick categories (reward type and lick number within lick bout). Right: Quantification of interpolated lick trajectory shape differences using Procrustes distance within a lick category (same reward and lick within lick bout) compared to across the two reward types (repeated measures ANOVA, followed by Tukey test, p = 0.0014; Within water to within sucrose: p = 0.33, within water to across: p = 0.0011, within sucrose to across: p = 0.071; n = 16 (sessions) - animals = 4). h PCA1 of the combined behavioral read-outs of whisker pad motion, pupil dilation and running speed (left) and the delta between the combined read-outs between water and sucrose 20% (right). Dashed line indicates a 3 standard deviation increase from baseline. i Schema of the viral and surgical strategy for two-photon recordings in the BLA with an example recording plane shown in (j). Red outlines indicate the spatial footprints of the extracted neurons. k Example traces of six simultaneously recorded neurons. l Single (opaque) and mean (solid) reward-triggered activity of the neurons in (k). m Calcium transient probability in response to reward consumption (n = 1846 (neurons) - animals = 10, sessions = 4). Dashed lines indicate a 3 standard deviation increase from baseline transient probability.
Fig. 2
Fig. 2. The BLA represents the value of gustatory rewards at the population level.
ae Characterization of reward concentration effects. a Schema of the randomly provided sucrose concentrations during the behavioral session (10 µl per reward). b Number of licks normalized to the 10 µl, 20% sucrose response in this session (repeated measures ANOVA, p = 9.29*10^(−15), n = 10 (animals), sessions = 4). Time-resolved mean population response of active BLA neurons (c) with corresponding quantification (Two-way RM ANOVA: rewards × animals, p = 1.81*10^(−27), n = 427 (neurons); animals = 10, sessions = 4) (d). e Average mean BLA response plotted against the mean licking for the Concentration session (n = 10 (animals), sessions = 4). fj Characterization of reward volume effects. f Schema of the randomly provided volumes of 20% sucrose during the behavioral session. g Number of licks normalized to the 10 µl, 20% sucrose response in this session (repeated measures ANOVA, p = 1.25*10^(−21), n = 10 (animals) - sessions = 2). Time-resolved mean population response of active BLA neurons (h) with corresponding quantification (Two-way RM ANOVA: rewards × animals, p = 0.013, n = 185 (neurons) − animals = 10, sessions = 2) (i). j Average mean BLA response plotted against the mean licking for the Volume session (n = 10 (animals) − sessions = 2). ko Characterization of reward type effects. k Schema of the randomly provided reward types during the behavioral session (10 µl per reward). l Number of licks normalized to the 10 µl, 20% sucrose response in this session (repeated measures ANOVA, p = 6.86*10^(−10), n = 10 (animals) - sessions = 3). Time-resolved mean population response of active BLA neurons (m) with corresponding quantification (Two-way RM ANOVA: rewards × animals, p = 5.62*10^(−19), n = 510 (neurons) − animals = 10, sessions = 4) (n). o Average mean BLA response plotted against the mean licking for the Diff. nutrient session (n = 10 (animals) - sessions = 3). Error bars depict SEM.
Fig. 3
Fig. 3. Distinct BLA sub-populations track stimulus-specific value.
a Schema of linear regression analysis performed to characterize single neuron tuning. b Correlation of individual neuron responses with lick bout size and the respective stimuli in the Concentration (left), Volume (middle) and Diff. nutrient (right) sessions with corresponding quantification in (c) (KS test, Bonferroni-corrected, Conc: p = 4.4*10^(−30), Vol: p > 0.5, Diff. nutrients: p = 9.43*10^(−74); Conc.-Vol. p = 1.7*10^(−6), Conc. - Diff. nutrients p = 4.63*10^(−13), Diff. nutrients - Vol. p = 2.84*10^(−21); - Concentrations: n = 427 (neurons) - animals = 10, sessions = 4; Volume: n = 185 (neurons); animals = 10, sessions = 2; Diff. nutrients: n = 510 (neurons) - animals = 10, sessions = 4). d Time-resolved activity of all significantly modulated neurons across the different behavioral sessions. e Venn diagrams displaying the reward specificity of individual neurons across different reward sessions with corresponding quantification of neurons active to only one reward shown in (f) (Chi² test, Bonferroni-corrected, Conc. - Vol. p = 0.0018, Conc. - Diff. nutrients p = 0.0209, Diff. nutrients - Vol. p = 3.83*10^(−8), Conc: n = 427 (neurons) — animals = 10, sessions = 4; Vol: n = 185 (neurons) - animals = 10, sessions = 2; Diff nutrients: n = 510 (neurons) - animals = 10, sessions = 4). g, h Trial-to-Trial correlation of the population vector (PV) for three example sessions of the types: Concentration, Volume, and Diff. nutrient with corresponding quantification of within reward vs. across reward PV-correlation for the individual sessions in (h) (repeated measures ANOVA, followed by Tukey test, Conc. - Vol. p = 0.97, Conc. – Diff. nutrients. p = 0.02, Diff. nutrients - Vol. p = 0.011, Conc.: n = 10 (animals) - sessions = 4; Vol.: n = 10 (animals) - sessions = 2; Diff. nutrients: n = 10 (animals) - sessions = 4).
Fig. 4
Fig. 4. BLA maintains coherence of value representation by re-scaling upon exposure to a new reward environment.
a Schema of the sessions, as presented in Fig. 2. b Number of licks in response in the concentration session (Session I) on a per animal basis (repeated measures ANOVA, followed by Tukey test, Conc. 10 µl - Vol. 10 µl: p = 0.0011; Vol. 16 µl - Vol. 10 µl: p = 0.0019; Conc. 10 µl - Vol. 16 µl: p > 0.5; Conc. water - Vol. water: p > 0.5; n = 10 (animals) - session = 4/2). c Time-resolved mean BLA response to rewards in the volume (dashed line) and concentration session (solid line) (d) with corresponding quantification of the relative BLA response of significantly responding neurons in the volume session (session II) subtracted from the mean response of significantly active neurons in the concentration session (session I) of the corresponding rewards depicted in (c) (repeated measures ANOVA, followed by Tukey test, water - 10 µl: p = 9.72*10^(−10); 10–16 µl: p = 2.33*10^(−6); water – 16 µl: p = 0.013; n = 185 (neurons) - animals = 10, sessions = 4/2). e Schema of the experimental design for simultaneous contrast characterization. Animals were given alternating blocks of rewards including (yellow line) or excluding (blue line) 40% sucrose. f Split violin plots without (left) and with (right) 40% sucrose present in the current block (paired t-test, p = 0.029, n = 104 (neurons) - animals = 4, sessions = 3). g Time-resolved mean BLA response to 20% in blocks without (blocks 1, 3, 5, 7) and the blocks with 40% sucrose (blocks 2, 4, 6). h Quantification of the BLA response change between 20% blocks (blocks 1–3, 3–5, 5–7, left), transitions from 20% blocks to 40% blocks (1–2, 3–4, 5–6, middle) and transitions from 40% blocks to 20% blocks (2–3, 4–5, 6–7, right) (one-sample t-tests, Bonferroni-corrected, p > 0.5; p = 0.01; p = 0.005; n = 218/174/176 (ΔNeuron activity) - animals = 4, sessions = 3, blocks = 3, neurons = 104). Error bars and shaded regions depict SEM.
Fig. 5
Fig. 5. Value representations in BLA are internal state dependent.
a Schema of water deprivation session design. b Comparison of the licking response to water during the water deprivation session with the concentration sessions (see Fig. 2b; paired t-test, p = 0.00022, n = 10 (animals) - sessions = 4/1). c Time-resolved mean BLA response to different rewards of significantly active neurons sorted by mean activity to water for water restriction (left) and control condition (right). d Quantification of the difference of all significantly active neurons for water responses in the control condition (concentration session) and water restriction session (two-sample t-test, Bonferroni-corrected, FR - WR: p = 2.4*10^(−10); FR: p = 8.48*10^(−36); WR: p = 0.27; FR: n = 427 (neurons); animals = 10, sessions = 4, WR: n = 104 (neurons); animals = 10, sessions = 1). e Time resolved activity of all BLA neurons during water restriction, and control session (see Fig. 2b). f Visualization of the overlap of significantly water and 20% sucrose responsive neurons in control session (upper panel) and water restricted session (lower panel). Normalized to the fraction of significantly 20% sucrose active neurons in the control session. g Schema of aversive session design. h Licking response comparing the licking during control session with this session (paired t-test, p = 4.14 *10^(−36); n = 10 (animals) - sessions = 3). i, j Time-resolved mean BLA response to 20% sucrose reward during the aversive session (solid line) and the food restricted session (dashed line; see Fig. 2b) with corresponding quantifications (two-sample t-test, p = 2.33*10^(−31), n = 427/258 (neurons) - animals = 10, sessions = 4/3) (j). k Less than 1% overlap of significantly responding neurons responding to aversive events and 20% sucrose. Shaded regions depict SEM.

References

    1. Allen, W. E. et al. Thirst regulates motivated behavior through modulation of brainwide neural population dynamics. Science364, eaav3932 (2019). - PMC - PubMed
    1. Vickery, T. J., Chun, M. M. & Lee, D. Ubiquity and specificity of reinforcement signals throughout the human brain. Neuron72, 166–177 (2011). - PubMed
    1. Tovote, P., Fadok, J. P. & Luthi, A. Neuronal circuits for fear and anxiety. Nat. Rev. Neurosci.16, 317–331 (2015). - PubMed
    1. Baxter, M. G. & Murray, E. A. The amygdala and reward. Nat. Rev. Neurosci.3, 563–573 (2002). - PubMed
    1. Dębiec, J., Díaz-Mataix, L., Bush, D. E. A., Doyère, V. & LeDoux, J. E. The amygdala encodes specific sensory features of an aversive reinforcer. Nat. Neurosci.13, 536–537 (2010). - PMC - PubMed

LinkOut - more resources