. 2025 Jun 5;16(1):5248.
doi: 10.1038/s41467-025-60535-5.

The TRIP12 E3 ligase induces SWI/SNF component BRG1-β-catenin interaction to promote Wnt signaling

Affiliations

The TRIP12 E3 ligase induces SWI/SNF component BRG1-β-catenin interaction to promote Wnt signaling

Sara Kassel et al. Nat Commun. .

Abstract

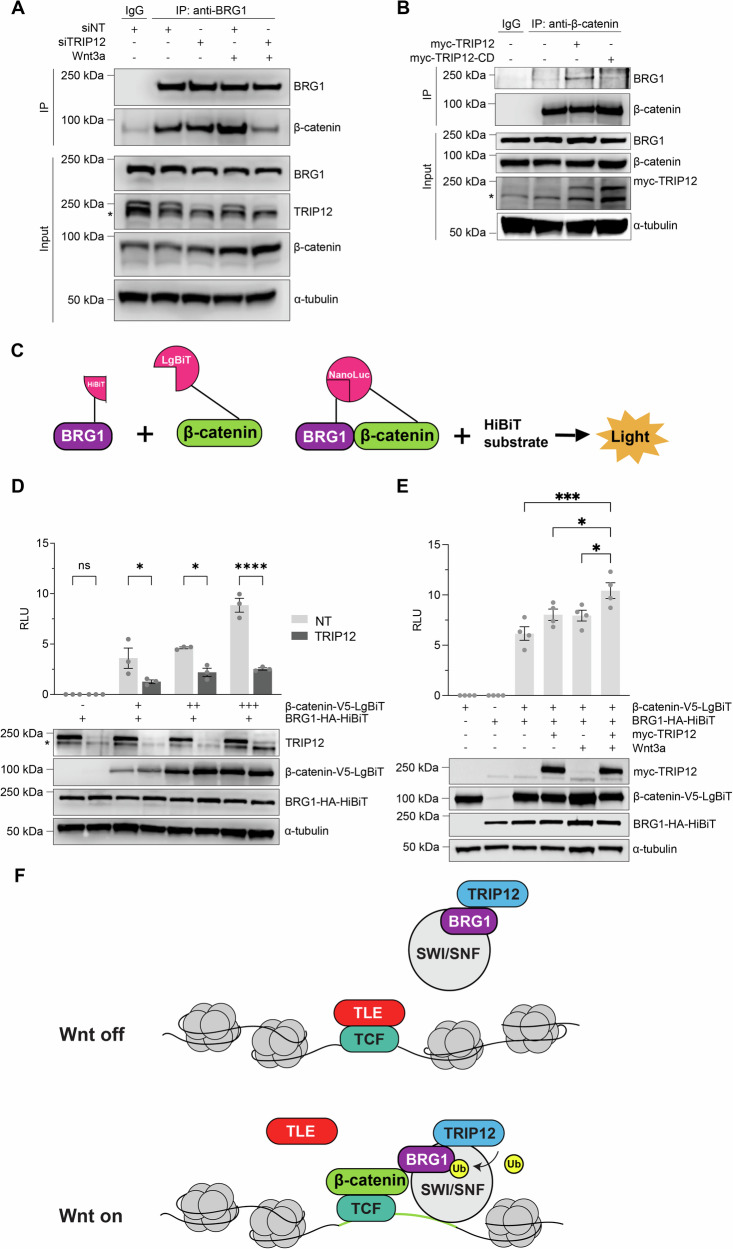
SWItch/Sucrose Non-Fermentable (SWI/SNF) chromatin remodeling complexes displace nucleosomes to promote the access of transcription factors to enhancers and promoters. Despite the critical roles of SWI/SNF in animal development and tumorigenesis, how signaling pathways recruit SWI/SNF complexes to their target genes is unclear. Here, we demonstrate that target gene activation mediated by β-catenin, the essential transcriptional coactivator in the Wnt signal transduction pathway, requires ubiquitylation of the SWI/SNF component Brahma-related gene-1 (BRG1) by the E3 ubiquitin ligase Thyroid Hormone Receptor Interactor 12 (TRIP12). TRIP12 depletion in Drosophila, zebrafish, mouse organoids, and human cells attenuates Wnt signaling. Genetic epistasis experiments place TRIP12 activity downstream of the β-catenin destruction complex. TRIP12 interacts with and ubiquitylates BRG1, and BRG1 depletion blocks TRIP12-mediated Wnt pathway activation. TRIP12 promotes BRG1 binding to β-catenin in the presence of Wnt. Our findings support a model in which TRIP12 ubiquitylates BRG1 in the presence of Wnt and promotes its interaction with β-catenin in the nucleus, in order to recruit SWI/SNF to Wnt target genes. Our studies suggest a general mechanism by which cell signaling induces the interaction between BRG1 and pathway-specific transcription factors to recruit SWI/SNF complexes to their appropriate target genes.


Conflict of interest statement

Competing interests: E.L. and D.J.R. are co-founders of StemSynergy Therapeutics, a company that seeks to develop inhibitors of major signaling pathways (including the Wnt pathway) for the treatment of cancer. The remaining authors declare that they have no competing interests.

Figures

Fig. 1
Fig. 1. TRIP12 promotes Wnt signaling in human cells and zebrafish.
A HEK293STF cells were transfected with nontargeting (siNT) or two independent TRIP12 siRNAs (siTRIP12#1 and #2) and incubated in the presence or absence of recombinant Wnt3a. TOPflash reporter activity quantified, and cell extracts immunoblotted for TRIP12 and β-catenin. α-tubulin is a loading control. *indicates a nonspecific band. Graphs show mean ± SEM of TOPflash normalized to cell number and control. Significance assessed using one-way ANOVA with Dunnett’s test. p-values for siNT + Wnt3a versus siTRIP12#1 and siTRIP12#2 are <0.0001. TOPflash and immunoblots represent at least three independent experiments. n = 3 wells of cells per treatment group per experiment, as shown in the dot plot. B HEK293STF cells transfected with empty vector control or plasmids encoding Myc-TRIP12 wild-type (WT) or Myc-TRIP12 catalytic-dead (CD) and incubated in the presence or absence of recombinant Wnt3a. TOPflash reporter activity quantified, and cell extracts immunoblotted for TRIP12 and β-catenin. α-tubulin is a loading control. Graphs show mean ± SEM of TOPflash normalized to cell number and control. Significance assessed with one-way ANOVA with Tukey’s test. p-value for myc-TRIP12 + Wnt3a versus control +Wnt3a is <0.0001 and for myc-TRIP12 + Wnt3a versus myc-TRIP12 CD + Wnt3a is 0.0028. C Zygotes injected with TRIP12 mRNA. Rescues were co-injected with TRIP12 MO. Representative images are shown on the left, with arrows indicating developing eyes. The percentage of eyeless embryos is graphed on the right. Scale bar = 200 mm. Significance analyzed by Fisher’s exact test (two-sided), p-value is 0.0081. D Co-injection with mRNA and MO rescues expression of Cyclin D1, Lef1, and c-myc. Total mRNAs isolated from injected single embryos, and Cyclin D1, Lef1, and c-myc levels quantified by RT-qPCR. Gene expression is graphed as ratio to β-actin control and normalized to uninjected embryo controls. Graphs show mean ± SEM, n = 3 independent embryo pools. Significance assessed using one-way ANOVA with Tukey’s test. p-values for Control versus TRIP12 MO, Control versus TRIP12 mRNA, TRIP12 mRNA versus TRIP12 mRNA + MO are 0.0000085, 0.092147, 0.0430227 for Cyclin D, 0.0947633, 0.0003199, 0.0033959 for Lef1, 0.0072358, 0.0002207, 0.0005341 for c-myc. *p < 0.05, **p < 0.01, ***p < 0.001, ****p < 0.0001, p ≥ 0.05 not significant (ns). Source data provided.
Fig. 2
Fig. 2. Ctrip promotes Wingless signaling in Drosophila.
RNAi constructs targeting yellow negative control or ctrip in the posterior compartment (marked by Engrailed (En, cyan)) of third instar larval wing discs using hedgehog (hh)-Gal4. Scarlet-Senseless (Scar-Sens, magenta) is a Wingless target gene reporter. DAPI (blue) marks nuclei. Scale bar (AF): 50 μm. Dorsal, top; posterior, right. Ahh-Gal4-driven expression of a yellow (y) RNAi control. Minimal loss of Scar-Sens was observed in the posterior compartment. DF hh-Gal4-driven expression of RNAi construct targeting ctrip decreases Scar-Sens in the posterior compartment. G Quantification is the percentage of wing discs with decreased Scar-Sens. N is the number of wing discs analyzed. RNAi constructs targeting yellow, arrow (positive control), or ctrip expressed using the C96-Gal4 driver. H C96-Gal4-driven expression of RNAi construct targeting yellow (y). No wing notches were observed. IM C96-Gal4-driven expression of RNAi constructs targeting arrow (arr) or ctrip resulted in notches at wing periphery. N Quantification for HM is shown as percentage of wings with notches. N is the number of wings analyzed. RNAi constructs targeting yellow, arrow (arr), or ctrip expressed in posterior midgut using the cad-Gal4 driver. frizzled3-GFP (green) is a Wingless target gene reporter. The dashed line indicates the midgut-hindgut boundary (MHB). O, P cad-Gal4-driven expression of y. No fz3-GFP reduction was observed. Q, R cad-Gal4-driven expression of RNAi targeting arr results in loss of fz3-GFP near midgut-hindgut boundary. S, T cad-Gal4-driven expression of RNAi targeting ctrip results in partial or complete loss of fz3-GFP expression in posterior midgut. DAPI (blue) marks nuclei. Scale bar (OT): 50 μm. U Quantification shown as percentage of intestines with decreased fz3-GFP. N is the number of adult intestines analyzed. Statistical significance (G, N, U) was analyzed by Fisher’s exact test (two-sided). p-values for G are <0.0001, 0.0005, 0.0024, <0.0001, <0.0001 respectively. p-values for N are all <0.0001. p-values for U are 0.0020, <0.0001, 0.0080, 0.0021, <0.0001, respectively. **p < 0.01, ***p < 0.001, ****p < 0.0001. Source data are provided in the Source Data file.
Fig. 3
Fig. 3. TRIP12 functions downstream of β-catenin stabilization.
A HEK293STF cells were transfected as indicated with nontargeting (siNT) control, TRIP12 siRNAs, Axin siRNAs, or TRIP12 and Axin siRNAs. TOPflash reporter activity quantified, and cell extracts immunoblotted for TRIP12, Axin, and β-catenin. *indicates a nonspecific band. Graphs show mean ± SEM of TOPflash normalized to cell number and control. Significance assessed using the one-way ANOVA with Tukey’s test. p-value for siAxin1 versus siNT is 0.0167 and for siAxin1 versus siAxin1 + siTRIP12 is 0.0366. For A and B, TOPflash and immunoblots are representative of at least three independent experiments. n = 3 wells of cells per treatment group per experiment. α-tubulin is loading control. B HEK293STF cells transfected as indicated with siNT control, TRIP12 siRNAs, APC siRNAs, or TRIP12 and APC siRNAs. TOPflash reporter activity quantified, and cell extracts immunoblotted for TRIP12, APC, and β-catenin. *indicates a nonspecific band. Significance assessed using one-way ANOVA with Tukey’s test. p-values for siAPC versus siNT and siAPC versus siAPC + siTRIP12 are <0.0001. APCmin organoids infected with control shRNA (Control) or three distinct shTrip12 lentiviral particles (#1, #2, and #3), imaged, and quantified for C, F organoid diameter (<200 μm) after 3 days, and evidence of D, G differentiation (villus formation, indicated by arrowheads) after 4 days. F: n > 50 organoids per experiment, G: n > 20 organoids per experiment. Scale bar in C 800 μm, D 50 μm. D GFP marks lentivirus-infected cells. Graphs show mean ± SEM of three independent replicates. Significance for F was analyzed by two-tailed Student’s t test and p-values are 0.0338, 0.0030, 0.0103, respectively. Significance for G was analyzed by one-tailed Student’s t test and p-values are 0.0286, 0.0058, 0.0046, respectively. E Immunoblotting was performed to confirm reduction in TRIP12 levels. HSP90 and α-tubulin are loading controls. Representative images are shown (n = 3 independent experiments). The dashed line between #2 and #3 represents intervening wells. *p < 0.05, **p < 0.01, ****p < 0.0001. Source data are provided in the Source Data file.
Fig. 4
Fig. 4. Ctrip acts downstream of β-catenin in Drosophila.
By comparison with control (A, F), RNAi-mediated depletion of Apc1 in ISCs during pupation using the esgts (temperature-sensitive driver) leads to an increase in progenitor cell (green) number in the midgut (R5A region) (B, C, F). Concomitant expression of the Apc1 RNAi construct with the ctrip RNAi construct leads to a significant reduction in progenitor cell number (D, E, F), in contrast with expression of an RNAi construct targeting yellow (B, F). Graphs show mean ± SEM, with all data points represented. Significance was assessed using the one-way ANOVA comparing all genotypes to control (yi2 + Apci), with Dunnett’s multiple comparisons test. N is the number of adult intestines analyzed. p-values for yi2 + Apci versus yi1, wgi + Apci, ctripi2 + Apci, ctripi3 + Apci are <0.0001, 0.9985, <0.0001, <0.0001, respectively. Progenitor cells are marked with esg > GFP (green) and nuclei are marked with DAPI (blue). Scale bar (AE): 50 μm. G Quantification is shown as the percentage of wing discs of each genotype with decreased ectopic Scar-Sens for HP. N is the total number of wing discs analyzed from three independent biological replicates. Statistical significance was analyzed by Fisher’s exact test (two-sided). p-values are both <0.0001. HP Representative confocal immunofluorescence images of constitutively active armS10 and GFP or RNAi constructs targeting ctrip were expressed in the wing pouch of third instar larval wing discs using the vgB-Gal4 driver. Scarlet-Senseless (Scar-Sens, magenta) is a Wingless target gene reporter, ArmS10-Myc (cyan), GFP (green). Scale bar (HP): 50 μm. Dorsal, top, and posterior, right. HJ Representative confocal immunofluorescence images of vgB-driven armS10 and GFP overexpression in wing pouch, which induces ectopic Scar-Sens positive cells. KP Representative confocal immunofluorescence images of co-expression of armS10 and RNAi against ctrip, which suppresses ectopic Scar-Sens-positive cells. ****p < 0.0001, p ≥ 0.05 is not significant (ns). Source data are provided in the Source Data file.
Fig. 5
Fig. 5. TRIP12 interacts with BRG1.
A Volcano plot of significantly enriched proteins in proximity labeling of 3xFLAG-turboID-TRIP12C2007A. HEK293T cells were treated with biotin or not and analyzed using label-free LC-MS/MS. Proteins with a change of greater than 1.5-fold (log2 > 0.6), p < 0.05 (n = 3 independent biological replicates, two-tailed t-test) in ±biotin comparison are in cyan. For A and B, proteins in dark blue are known interactors of TRIP12, and proteins in black are known components of SWI/SNF. B Volcano plot of significantly enriched proteins in 3xFLAG-TRIP12C2007A immunoprecipitation versus control and analyzed by AP/MS. Proteins with a change of greater than 1.5-fold (log2 > 0.6), p < 0.05 (n = 3 independent biological replicates, two-tailed t-test) in 3x-FLAG-TRIP12C2007A/control comparison are in cyan. C Schematic of N-terminal 3xFLAG-turboID biotin ligase-tagged TRIP12WT and catalytically inactive TRIP12C2007A and their immunoblot in HEK293T cell lysates. Venn diagram comparing TRIP12 interactors identified by proximity labeling and AP/MS. Among the commonly identified proteins were the known TRIP12 interactors PARP1, USP7, and BAF57, and SWI/SNF components BRG1 and BAF170. D Over-representation analysis of 358 common and specific TRIP12 interactors revealed chromatin assembly and disassembly as the most enriched gene ontology (GO) term with an enrichment ratio of 12.22, FDR < 0.05. E HEK293FT cells transfected with Myc-TRIP12-CD, incubated in the presence or absence of recombinant Wnt3a. Myc-TRIP12-CD immunoprecipitated with Myc antibody. Coimmunoprecipitated, endogenous BRG1 detected by immunoblotting. Immunoblots representative of at least three independent experiments. α-tubulin is a loading control. F RPE cells treated in the absence or presence of recombinant Wnt3a for 4 h, immunostained for BRG1 and/or TRIP12, and a proximity ligation assay performed with quantitation (G). n = 5 images. Representative images are shown (n = 3 independent experiments). Graph shows mean ± SEM of total red intensity normalized to cell number. Significance assessed using one-way ANOVA with Tukey’s test. p-values for Control versus BRG1 + TRIP12 and Control + Wnt3a versus BRG1 + TRIP12 + Wnt3a are <0.0001. p-value for BRG1 + TRIP12 versus BRG1 + TRIP12 + Wnt3a is 0.3287. Scale bar: 50 μm. ****p < 0.0001, p ≥ 0.05 is not significant (ns). Source data are provided in the Source Data file.
Fig. 6
Fig. 6. BRG1 promotes Wnt/Wingless signaling.
A HEK293STF cells transfected with nontargeting (siNT) control or three independent BRG1 siRNAs (siBRG1 #1, #2, and #3), incubated in the absence or presence of recombinant Wnt3a. TOPflash reporter quantified, and cell extracts immunoblotted for BRG1 and β-catenin. For A and B, graphs show mean ± SEM of TOPflash normalized to cell number and NT control. Significance assessed using one-way ANOVA with Dunnett’s test. All TOPflash results and immunoblots represent at least three independent experiments. n = 3 wells of cells per treatment group per experiment. α-tubulin is a loading control. p-values for siNT + Wnt3a versus siBRG1#1 + Wnt3a, siBRG1#2 + Wnt3a, and siBRG1#3 + Wnt3a are all <0.0001. B HEK293STF cells transfected with indicated expression constructs and incubated in the presence of recombinant Wnt3a. TOPflash reporter activity quantified, and cell extracts immunoblotted for Myc-TRIP12 and BRG1. p-value for siNT versus siNT + myc-TRIP12 is 0.0218 and for siNT + myc-TRIP12 versus siBRG1 + myc-TRIP12 is 0.0052. CH RNAi constructs targeting yellow (y) control or brahma (brm) expressed in posterior compartment (marked by Engrailed (En, cyan)) of third instar larval wing discs using hedgehog (hh)-Gal4. Scarlet-Senseless (Scar-Sens, magenta) is a Wingless target gene reporter. C, D hh-Gal4-driven expression of y RNAi. Minimal loss of Scar-Sens was observed. EH hh-Gal4-driven expression of independent RNAi targeting brm resulted in decreased Scar-Sens in the posterior compartment. Dorsal, top, and posterior, right. I Quantification is the percentage of discs with decreased Scar-Sens. N is number of wing discs analyzed. J RNAi constructs targeting y control or brm in posterior midgut using cad-Gal4. frizzled3-GFP (fz3-GFP, green) is a Wingless target gene reporter. J, K cad-Gal4-driven expression of y control RNAi. No fz3-GFP reduction was observed. L–O cad-Gal4-driven expression of brm RNAi resulted in partial loss of fz3-GFP. P Quantification shown as percentage of intestines with decreased fz3-GFP. N is the number of adult intestines analyzed. DAPI (blue) marks nuclei. Scale bar (CH, JO): 50 μm. Statistical significance (I, P) was analyzed by Fisher’s exact test (two-sided). p-values for I are 0.0090 and <0.0001. p-values for P are <0.0001 and 0.0415. *p < 0.05, **p < 0.01, ****p < 0.0001. Source data are provided.
Fig. 7
Fig. 7. TRIP12 ubiquitylates BRG1 but does not affect its stability.
A HEK293FT cells were transfected with Myc-TRIP12 with or without Wnt3a and MG132 treatment. In A and B, ubiquitylated proteins were pulled down with MBP-TUBE. BRG1 and TRIP12 were detected by immunoblotting. MBP-TUBE and α-tubulin are loading controls. B HEK293FT cells transfected with control vector, Myc-TRIP12 wild-type (TRIP12) or Myc-TRIP12 catalytic dead (TRIP12-CD) and FLAG-BRG1 and treated with Wnt3a and MG132. C HEK293FT cells were transfected with nontargeting (siNT) or two pooled TRIP12 siRNAs and control vector or HA-Ubiquitin (HA-Ub). Cells treated with Wnt3a and MG132 and extracts immunoprecipitated with BRG1 antibody or immunoglobulin G (IgG). Ubiquitylated BRG1 detected with HA antibody. D Recombinant BRG1 incubated with GST-TRIP12-HECT domain. Ubiquitylated BRG1 was detected by immunoblotting. EL yellow (y) control or ctrip RNAi expressed in the dorsal compartment of larval wing discs using apterous (ap)-Gal4. E, H, K, L ap-Gal4-driven expression of y RNAi control. No change observed in Bap111-GFP (green) or Brm-GFP (green) levels. F, G, K ap-Gal4-driven expression of ctrip RNAi increased Bap111-GFP (green) levels in the dorsal compartment. I, J, L ap-Gal4-driven expression of ctrip RNAi in the dorsal compartment results in no change in Brm-GFP levels (green). Arrows denote the dorsal-ventral boundary. K, L Quantification of GFP mean intensity as dorsal-ventral ratio. Bap111 level increased in the dorsal compartment upon Ctrip knockdown and quantified K. Graphs show mean ± SEM, n = 9, 9, 14 in K, n = 12, 11, 9 in L. N is the number of wing discs analyzed. Significance assessed using one-way ANOVA with Dunnett’s test, comparing genotypes to control (yi1). p-values for K are both <0.0001. p-values for L are 0.1749 and 0.1986. Scale bar (EJ): 50 μm. Dorsal, top; posterior, right. M HEK293FT cells transfected with empty vector or Myc-TRIP12, treated with recombinant Wnt3a, and immunoblotted for TRIP12 and BRG1. *indicates nonspecific band in M and N. N HEK293FT cells transfected with nontargeting (siNT) control or TRIP12 siRNAs, treated with recombinant Wnt3a. Lysates were immunoblotted for endogenous TRIP12 and BRG1. α-tubulin is a loading control. All immunoblots represent at least three independent experiments. ****p < 0.0001, p ≥ 0.05 is not significant (ns). Source data provided.
Fig. 8
Fig. 8. TRIP12 promotes the interaction of BRG1 with β-catenin.
A HEK293FT cells were transfected with nontargeting (siNT) control or two pooled TRIP12 siRNAs and incubated in the presence or absence of Wnt3a. Endogenous BRG1 was immunoprecipitated with a BRG1 antibody. IgG was used as a negative control. Coimmunoprecipitated, endogenous β-catenin was detected by immunoblotting. *indicates a nonspecific band. B HEK293FT cells were transfected with wild-type or catalytic dead TRIP12 as indicated. Endogenous β-catenin was immunoprecipitated with a β-catenin antibody. IgG was used as a negative control. Coimmunoprecipitated, endogenous BRG1 was detected by immunoblotting. Immunoblots are representative of at least three independent experiments. α-tubulin is a loading control. *indicates a nonspecific band. C HiBiT-tagged BRG1 was co-overexpressed with LgBiT-tagged β-catenin. When the two proteins are in close proximity, the HiBiT and LgBiT proteins interact and form a functional NanoBit luciferase enzyme. Addition of the HiBiT substrate results in an enzymatic reaction that produces a light signal, which was used as a readout for the interaction between BRG1 and β-catenin. HEK293FT cells were transfected as indicated and TRIP12 was knocked down (D) or overexpressed (E). Cells were treated with or without Wnt3a as indicated and luminescence was quantified as relative light units (RLU). Cell extracts were immunoblotted for TRIP12, β-catenin-V5-LgBiT, and BRG1-HA-HiBiT. *indicates a nonspecific band. α-tubulin is a loading control. Graphs show mean ± SEM of luminescence normalized to cell number. Significance was assessed using the one-way ANOVA with Tukey’s test. p-value for NT versus TRIP12 is >0.9999 (–), 0.0401 (+), 0.0297 (++), and <0.0001 (+++). p-value for myc-TRIP12 + Wnt3a versus control is 0.0002, versus myc-TRIP12 is 0.0473, and versus control + Wnt3a is 0.0369. All HiBiT results and immunoblots are representative of at least three independent experiments. n = 3–4 wells of cells per treatment group per experiment. F Upon Wnt pathway activation, TRIP12 ubiquitylates BRG1 and promotes BRG1 association with β-catenin. *p < 0.05, ***p < 0.001, ****p < 0.0001, p ≥ 0.05 is not significant (ns). Source data are provided in Source Data file.

References

    1. Horn, P. J. & Peterson, C. L. Heterochromatin assembly: a new twist on an old model. Chromosome Res.14, 83–94 (2006). - PubMed
    1. Peterson, C. L. & Herskowitz, I. Characterization of the yeast SWI1, SWI2, and SWI3 genes, which encode a global activator of transcription. Cell68, 573–583 (1992). - PubMed
    1. Kwon, H., Imbalzano, A. N., Khavari, P. A., Kingston, R. E. & Green, M. R. Nucleosome disruption and enhancement of activator binding by a human SW1/SNF complex. Nature370, 477–481 (1994). - PubMed
    1. Rim, E. Y., Clevers, H. & Nusse, R. The Wnt pathway: from signaling mechanisms to synthetic modulators. Annu. Rev. Biochem.91, 571–598 (2022). - PubMed
    1. Saito-Diaz, K. et al. The way Wnt works: components and mechanism. Growth Factors31, 1–31 (2013). - PMC - PubMed

LinkOut - more resources