. 2025 Jun 5;16(1):5227.
doi: 10.1038/s41467-025-60583-x.

β-propeller protein-associated neurodegeneration protein WDR45 regulates stress granule disassembly via phase separation with Caprin-1

Affiliations

β-propeller protein-associated neurodegeneration protein WDR45 regulates stress granule disassembly via phase separation with Caprin-1

Yin Li et al. Nat Commun. .

Abstract

β-propeller protein-associated neurodegeneration (BPAN) is a rare X-linked neurodegenerative disorder caused by mutations in the WDR45 gene, yet its molecular mechanisms remain poorly understood. Here, we identify a role for WDR45 in stress granule (SG) disassembly, mediated through its phase separation with Caprin-1. We demonstrate that WDR45 forms gel-like condensates via its WD5 domain, which competitively displaces G3BP1 from Caprin-1 to promote SG disassembly. BPAN-associated WDR45 mutations impair condensate formation and Caprin-1 interaction, leading to delayed SG disassembly, which correlates with earlier disease onset. WDR45 depletion also exacerbates amyotrophic lateral sclerosis-associated pathological SGs, highlighting its broader relevance to neurodegenerative diseases. Using iPSC-derived midbrain neurons from a BPAN patient, we demonstrate delayed SG recovery, directly linking WDR45 dysfunction to neurodegeneration. These findings establish WDR45 as a critical regulator of SG dynamics, uncover a potential molecular basis of BPAN pathogenesis, and identify therapeutic targets for neurodegenerative diseases associated with SG dysregulation.


Conflict of interest statement

Competing interests: The authors declare no competing interests.

Figures
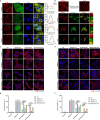
Fig. 1
Fig. 1. WDR45 regulates SG disassembly under various stress conditions.
a Confocal images of U2OS cells treated with different stressors and stained with anti-G3BP1 (Red) and anti-WDR45 (Green) antibodies and DAPI (Blue) are shown. Stressors include sodium arsenite (SA, 500 μM, 1 h), heat shock (HS, 44 °C, 2 h), and osmotic stress (Sorbitol, 400 mM, 2 h). White boxes indicate the enlarged ROI and are displayed in separate channels (Zoom). Line graphs in the right panels show WDR45 and G3BP1 signals along the indicated white lines in the insets. Scale bar, 10 μm. b Representative confocal microscopy images of neural progenitor cells induced from induced pluripotent stem cells stained with anti-PAX6 (Red) (Left). Following the differentiation and maturation process, neural progenitor cells were induced into midbrain neurons which were stained with anti-TUJ1 (Red) (Right). Scale bar, 10 μm, and representative confocal images of G3BP1 (Red) and WDR45 (Green) in midbrain neurons treated with SA (SA, 500 μΜ, 45 min) and heat shock (HS, 1 h). Scale bar, 10 μm. The inset indicates the magnifying region of the white box. Inset scale bar, 1 μm. c WT, WDR45, WDR45B knockout cell lines and WDR45&WDR45B double knockout cell lines were untreated, treated with SA for 1 h, or recovered (Re) for 1.5 h, 2 h after SA removal. Confocal images of U2OS cells stained with anti-G3BP1 (Red) and DAPI (Blue) are shown. Scale bar, 10 μm. d Quantification of Cell with SGs percent (n = 3 independent experiments, every treatment cell number>200) under SA and at the recovery stage from stress as represented in (c). Data are shown as mean ± SD. ns, not significant, ****p < 0.0001 (two-way ANOVA with Tukey’s test). e WT, WDR45, WDR45B knockout cell lines and WDR45 WDR45B double knockout cell lines were untreated, treated with heat shock for 1 h, or recovered for 1.5 h, 2 h after removal of heat shock. Confocal images of U2OS cells treated with SGs induction stressors and stained with anti-G3BP1 (Red) and DAPI (Blue) are shown. Scale bar, 10 μm. f Quantification of Cell with SGs percent (n = 3 independent experiments, every treatment cell number>200) under heat shock and at the recovery stage from stress as represented in (e). Data were pooled from three independent experiments. Data are shown as mean ± SD. ns, not significant, ****p < 0.0001 (two-way ANOVA with Tukey’s test). Source data are provided as a Source Data file.
Fig. 2
Fig. 2. WDR45 interacts with Caprin-1 and undergoes LLPS with Caprin-1.
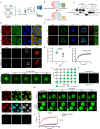
a Comparative proteomic analysis of GFP (control group) and WDR45-GFP (experimental group) under SA treatment and untreated conditions. Cells expressing either GFP or WDR45-GFP were treated with SA for 1 hour or left untreated as controls. Each experimental condition was performed in triplicate to ensure reproducibility and statistical robustness (Created with Biorender.com). b Venn diagrams comparing the proteomes of CON-WDR45 and SA-WDR45 with the core components of SGs. The green box highlights the shared proteins between CON-WDR45 proteome and the SG core components. The orange box highlights the shared proteins between SA-WDR45 proteome and the SG core components. c Western blot analysis of immunoprecipitation (IP) experiments using GFP (control), WDR45-GFP, and WDR45B-GFP. IP was performed using antibodies against GFP to assess the interaction with Caprin-1. d Representative confocal images of U2OS cells under control and SA treatment (500 μM 45 min) stained with anti-Caprin-1 (Red) and anti-WDR45 (Green). DAPI is shown in blue. Scale bar, 10 μm. e Representative confocal images of U2OS WT and CAPRIN1 KO cells under SA treatment (500 μM 45 min) stained with anti-G3BP1 (Red) and anti-WDR45 (Green). DAPI is shown in blue. Scale bar, 10 μm, Zoom’s Scale bar, 1 μm. f Representative SIM (Structure Illumination Microscopy) images of G3BP1-positive SGs (Red) and WDR45 (Green) in WT and CAPRIN1 KO U2OS cells. Scale bar, 1 μm, Zoom’s Scale bar, 0.5 μm. g Scatterplot representing the co-localization correlation between G3BP1 and WDR45 signal (WT and CAPRIN1 KO cells) during the SA stage as represented in (f). Data are shown as mean ± SD. Statistical significance was determined using an unpaired and two-sided t-test comparison. Each cell represents the Pearson coefficient analysis of cell ROI. ****P < 0.0001. n = 20 from 3 independent experiments. h Relative fluorescence intensity of WDR45-GFP before and after photobleaching over time. Data are represented as mean ± SEM for n = 7. i Dynamics of WDR45 foci indicated by the yellow circle in U2OS cells stably transfected with WDR45-GFP were analyzed using FRAP. Representative images of the same foci before and after photobleaching are shown. Scale bar, 1 μm. j Phase diagram of WDR45 in vitro. k 1,6-hexanediol (1,6-HD) destroys the WDR45 condensates in vitro. Scale bar, 10 μm. l LLPS of purified recombinant G3BP1 (Cyan), Caprin-1 (Red), and WDR45 (Green) in vitro. Recombinant proteins were mixed pairwise at a 1:1 molar ratio (Caprin-1 + WDR45, G3BP1 + Caprin-1, G3BP1 + WDR45) to observe LLPS under physiological conditions with 150 mM NaCl. Scale bar, 10 μm. m Dynamics of WDR45 (or +Caprin-1) foci (Green) indicated by yellow circle in vitro were analyzed using FRAP. Representative images of the same foci before and after photobleaching are shown. Scale bar, 5 μm. n Relative fluorescence intensity of WDR45 (or +Caprin-1) before and after photobleaching over time. Data are represented as mean ± SEM. ****p < 0.0001 by paired and two-sided t-test. n = 17 for WDR45+Caprin-1, n = 7 for WDR45 alone. Source data are provided as a Source Data file.
Fig. 3
Fig. 3. WDR45 competes with G3BP1 for Caprin-1 binding to facilitate SG disassembly.
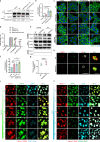
a Western blot analysis of immunoprecipitation (IP) experiments examining the Caprin-1 enrichment capability in U2OS cells expressing WDR45-GFP under different conditions: control (untreated), SA treatment for 1 hour (SA 1 h), and recovery periods of 1.5 hours and 2 hours post-treatment. (n = 3 independent experiments). b Quantification of Caprin-1 enrichment ability with WDR45-GFP under SA treatment and during recovery stages, as represented in (a). Data were pooled from three independent experiments and normalized to the control condition. Results are presented as mean ± SD, with statistical significance indicated by *p < 0.05 and **p < 0.01, determined by one-way ANOVA with Tukey’s test. c WT, WDR45, CAPRIN1 knockout cell lines and WDR45&CAPRIN1 double knockout cell lines were untreated, treated with SA for 1 h, or recovered for 1.5 h, 2 h after removal of SA. Confocal images of U2OS cells treated with SGs induction stressors and stained with anti-G3BP1 (Green) and DAPI (Blue) are shown. Scale bar, 10 μm. d Quantification of Cell with SGs percent under SA (n = 3 independent experiments) and at the recovery stage from stress as represented in (c). Data were pooled from three independent experiments. Data are shown as mean ± SD. ns, not significant, ****p < 0.0001 (two-way ANOVA with Tukey’s test). e Western blot analysis of endogenous immunoprecipitation (IP) performed with G3BP1 to assess the interaction with Caprin-1 in wild-type (WT) and WDR45 knockout (KO) cells. The enrichment ability of G3BP1 for Caprin-1 was assessed under two conditions: control (untreated) and SA treatment (SA). (n = 3 independent experiments). f Quantification of G3BP1’s ability to enrich Caprin-1 under control and SA treatment conditions, as shown in (e). Data were pooled from three independent experiments and normalized to Caprin-1 enrichment in WT cells under the control condition. Results are presented as mean ± SD, with statistical significance indicated by *p < 0.05, determined by one-way ANOVA with Tukey’s test. g Scatterplot representing the co-localization correlation between G3BP1 and Caprin-1 signal (WT and WDR45 KO cells) during the SA stage. Data are shown as mean ± SD. Statistical significance was determined using an unpaired and two-sided t-test. ***p < 0.001. n = 20 from 3 independent experiments. h Representative SIM (Structure Illumination Microscopy) images of G3BP1-positive SGs (Red) and Caprin-1 (Green) in WT and WDR45 KO U2OS cells. Scale bar, 1 μm, Zoom’s Scale bar, 0.5 μm. (i), LLPS of purified recombinant G3BP1 (Cyan), Caprin-1 (Red), and WDR45 (Green) in vitro. Keep the concentrations of G3BP1 and Caprin-1 constant while gradually increasing the concentration of WDR45 to observe LLPS under physiological conditions with 150 mM NaCl. LLPS was visualized using confocal microscopy. Scale bar, 10 μm. j LLPS of purified recombinant G3BP1 (Cyan), Caprin-1 (Red), and WDR45 (Green) in vitro. Keep the concentrations of WDR45 and Caprin-1 constant while gradually increasing the concentration of G3BP1 to observe LLPS under physiological conditions with 150 mM NaCl. Scale bar, 10 μm. Source data are provided as a Source Data file.
Fig. 4
Fig. 4. WD5 domain in WDR45 mediates LLPS with Caprin-1.
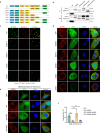
a Schematic diagram of WDR45 domain structure and amino acid sequence of each domain. Truncations of ΔWD1-4, ΔWD5-7, ΔWD5-6, ΔWD6-7, ΔWD7, ΔWD6, ΔWD5 are shown. b Western blot analysis of immunoprecipitation (IP) experiments examining the Caprin-1 enrichment capability in U2OS cells expressing GFP, WDR45-GFP and its truncations under control (untreated). c LLPS of purified recombinant Caprin-1 (Red), WDR45 and its truncations (Green) in vitro. Recombinant proteins were mixed pairwise at 1:1 molar ratio to observe LLPS under physiological conditions with 150 mM NaCl. Scale bar, 10 μm. d Confocal images of U2OS cells (expressing GFP, WDR45-GFP and its truncations) that were treated with SA and stained with anti-G3BP1 (Red) antibody and DAPI (Blue) are shown. Scale bar, 10 μm. e Confocal images of WDR45 KO U2OS cells (expressing GFP, WDR45-GFP and its truncations) that were treated with SA and recovery 2 h stained with anti-G3BP1 (Red) antibody and DAPI (Blue) are shown (n = 3 independent experiments, every treatment cell number>200). Scale bar, 10 μm. f Quantification of Cell with SGs percent under SA, at the recovery stage from stress as represented in (e). Data were pooled from three independent experiments. Data are shown as mean ± SD. ns, not significant, **p < 0.01, ****p < 0.0001 (one-way ANOVA with Tukey’s test). Source data are provided as a Source Data file.
Fig. 5
Fig. 5. BPAN-associated mutations in WDR45 impair its function in SG disassembly.
a Schematic diagram of β-propeller protein-associated neurodegeneration (BPAN) related WDR45 mutations’ domain structure. b The phase separation ability of respective WDR45 mutants was graphed alongside the age of onset for neurodegenerative symptoms. The age of onset for these symptoms is provided in parentheses after each mutation. The Pearson’s correlation coefficient (R) reflecting the correlation between the extent of condensates formation ability defects and the age of onset for these symptoms is presented. c Western blot analysis of Co-IP experiments using GFP-trap to assess the interaction between WDR45-GFP, and its mutations with Caprin-1. d LLPS of purified recombinant Caprin-1 (Red), WDR45 and its mutations (Green) in vitro. Recombinant proteins were mixed pairwise at 1:1 molar ratio to observe LLPS under physiological conditions with 150 mM NaCl. Scale bar, 10 μm. e Quantification of droplets area for Caprin-1 and WDR45 and its mutations as represented in (d). Data are shown as mean ± SD. ns, not significant, ****p < 0.0001 (one-way ANOVA with Tukey’s test). WT: n = 72; R13P: n = 63; L98P: n = 43; N202K: n = 45; G204D: n = 49; A209D: n = 51; S210P: n = 52; S251 del: n = 56 from 3 independent experiments. f Confocal images of WT U2OS cells (expressing GFP, WDR45-GFP and its mutations) that were treated with SA and stained with anti-G3BP1 (Red) antibody and DAPI (Blue) are shown. Scale bar, 10 μm. g Summary of WDR45 and its mutants in relation to SG localization. h Confocal images of WDR45 KO U2OS cells (expressing GFP, WDR45-GFP and its mutations) that were treated with SA and recovery 2 h stained with anti-G3BP1 (Red) antibody and DAPI (Blue) are shown (n = 3 independent experiments, every treatment cell number>200). Arrowheads indicate the successfully transfected cells. Scale bar, 10 μm. i Quantification of Cell with SGs percent under SA, at the recovery stage from stress as represented in (h). Data were pooled from three independent experiments. Data are shown as mean ± SD. ns, not significant, ***p < 0.001, ****p < 0.0001 (one-way ANOVA with Tukey’s test). Source data are provided as a Source Data file.
Fig. 6
Fig. 6. The accumulation of ALS-related pathological SGs in WDR45 KO cells.
a WT and WDR45 KO cells under normal conditions were transfected with plasmids encoding HA-tagged wild-type FUS (FUS WT) and FUS-R521C (FUS R521C) and stained for HA and TIAR (a SG marker). Scale bar, 10 μm. b Quantification of Cell with FUS-positive SGs percent under control as represented in (a). Data are shown as mean ± SD. ***p < 0.001 (unpaired and two-sided t-test) n = 3 independent experiments. c WT and WDR45 KO cells under normal conditions were transfected with plasmids encoding HA-tagged wild-type FUS (FUS WT) and FUS-R521C (FUS R521C) and stained for HA and TIAR. Scale bar, 10 μm. d Quantification of area for FUS-positive SGs. Scatter plot showing the cytoplasmic FUS area (μm2) in WT (mean=0.705 μm2, n = 147) and WDR45 KO (mean=2.797 μm2, n = 143) cell lines. ****p < 0.0001 (unpaired and two-sided t-test) n = 3 independent experiment. e WT and WDR45 KO cells under normal condition were transfected with plasmid encoding GFP-tagged GR50 and stained for G3BP1. White arrowheads indicate the GR-positive SGs. Scale bar, 10 μm. Zoom’s scale bar, 10 μm. f Quantification of Cell with GR50-SGs percent under control as represented in (e). Data are shown as mean ± SD. ***p < 0.001 (unpaired and two-sided t-test) n = 3 independent experiment. Source data are provided as a Source Data file.
Fig. 7
Fig. 7. iPSC-derived midbrain neurons from WDR45-mutant patient show delayed SG recovery.
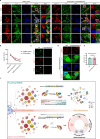
a Representative confocal images of neurons from patient and age-matched control. Neurons were subjected to SA stress for 30 min and recovered for 120 min and 150 min, and then stained with anti-Caprin-1 (Red) and anti-TUJ1 (Green). Nuclei were stained with DAPI. Scale bar, 10 μm. Zoom’s scale bar, 10 μm. b Statistical results of cells with SGs under different treatments as represented in (b). Data were performed with three biological repeats. Data are presented as mean ± SD. ns, not significant, **p < 0.01 by two-way ANOVA. c LLPS of purified recombinant Caprin-1 (Red), WDR45 Patient (Green) in vitro. Recombinant proteins were mixed pairwise at a 1:1 molar ratio to observe LLPS physiological conditions with 150 mM NaCl. Scale bar, 10 μm. d Confocal images of WDR45 KO U2OS cells (expressing GFP, p(Ala276AlafsTer1)) that treated with SA following recovered for 120 min, and stained with anti-G3BP1 (Red) antibody and DAPI (Blue) are shown, n = 3 independent experiment. Scale bar, 10 μm. e Quantification of Cell with SGs percent under SA, at the recovery stage from stress as represented in (d). Data were pooled from three independent experiments. Data are shown as mean ± SD. ns, not significant (unpaired and two-sided t-test). f A proposed model of WDR45-mediated SG disassembly. Functional WDR45 helps SGs disassembly through competing with G3BP1 for Caprin-1, thus weakening the SGs core network. While mutated WDR45 (WDR45 KO or BPAN-related WDR45 mutations) failed to interact with Caprin-1, and causing SGs disassembly defect (Created with Biorender.com). Source data are provided as a Source Data file.

Similar articles

References

    1. Haack, T. B. et al. Exome sequencing reveals de novo WDR45 mutations causing a phenotypically distinct, X-linked dominant form of NBIA. Am. J. Hum. Genet.91, 1144–1149 (2012). - PMC - PubMed
    1. Hayflick, S. J. et al. β-Propeller protein-associated neurodegeneration: a new X-linked dominant disorder with brain iron accumulation. Brain136, 1708–1717 (2013). - PMC - PubMed
    1. Haack, T. B., Hogarth, P., Gregory, A., Prokisch, H. & Hayflick, S. J. BPAN: the only X-linked dominant NBIA disorder. Int Rev. Neurobiol.110, 85–90 (2013). - PubMed
    1. Hayflick, S. J., Kurian, M. A. & Hogarth, P. Neurodegeneration with brain iron accumulation. Handb. Clin. Neurol.147, 293–305 (2018). - PMC - PubMed
    1. Ji, C., Zhao, H., Chen, D., Zhang, H. & Zhao, Y. G. β-propeller proteins WDR45 and WDR45B regulate autophagosome maturation into autolysosomes in neural cells. Curr. Biol.31, 1666–1677.e1666 (2021). - PubMed

MeSH terms