. 2025 Jun 5;16(1):5230.
doi: 10.1038/s41467-025-60618-3.

An archaeal nucleoid-associated protein binds an essential motif in DNA replication origins

Affiliations

An archaeal nucleoid-associated protein binds an essential motif in DNA replication origins

Rajkumar Dhanaraju et al. Nat Commun. .

Abstract

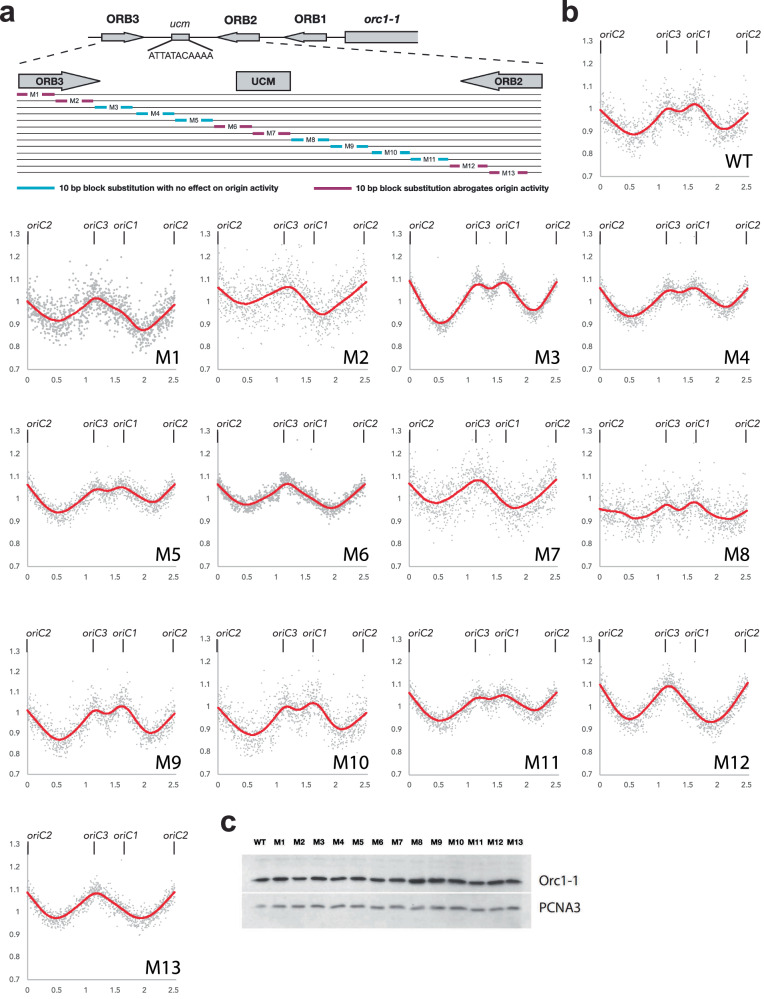
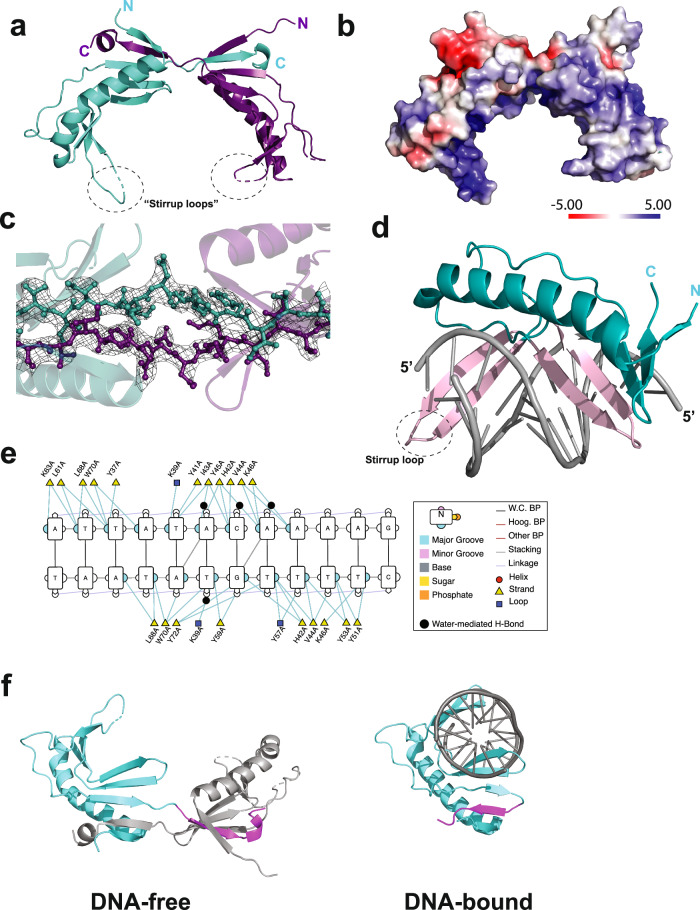
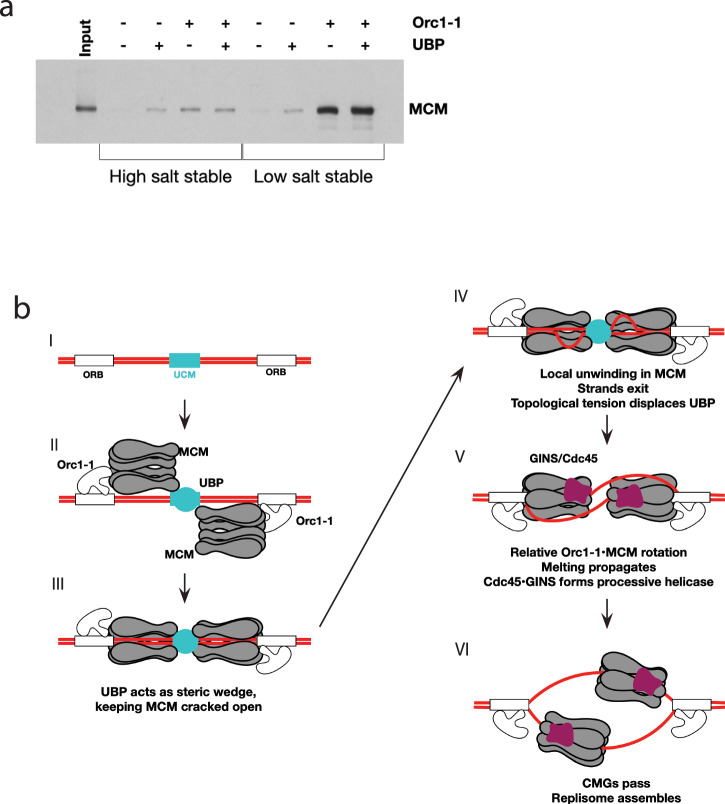
DNA replication typically has defined start sites, or replication origins, which are designated by their recognition by specific initiator proteins. In addition to initiators, general chromatin or nucleoid-associated proteins have been shown to play roles in modulating origin efficiency in eukaryotes and bacteria. The role of chromatin proteins in origin function in the archaeal domain of life is poorly understood. Here, we describe a dissection of sequences elements required for in vivo function of an archaeal DNA replication origin. Our data reveal a hitherto uncharacterized sequence element, the ucm, is required for origin activity. We identify a protein, UBP, that interacts with the ucm and additionally with hundreds of other sites on the genome. We solve the crystal structure of UBP alone and in complex with ucm DNA, and further show that UBP interacts with the MCM replicative helicase. Taken together, our data provide evidence that UBP functions as a general nucleoid-associated protein that plays a key role in facilitating the egress of the MCM replicative helicase from DNA replication origins.


Conflict of interest statement

Competing interests: The authors declare no competing interests.

Figures

Fig. 1
Fig. 1. Determination of sequence requirements for oriC1 function in vivo.
a Schematic of the organization of Sulfolobus islandicus oriC1. The upper panel shows the position and orientation of the Orc1–1-binding ORB elements, the ucm and the position of the orc1–1 gene. The expanded panel below indicates the regions targeted in the linker scanning mutagenesis. Substitutions that impact on origin activity are shown in purple while those with no effect are shown in cyan. b Marker frequency assays with wild-type (WT) and the indicated mutants (M1–M13) are shown. The position of the three replication origins are shown above each panel (oriC2 lies at the point of in silico linearization of the circular genome and is thus indicated at the beginning and end of the X-axis). Data were binned in 1 kb intervals and normalized to wild-type stationary phase cell DNA content. c Western blot analysis of whole cell extracts from wild-type (WT) and the indicated mutants (M1–M13) with antisera generated against Orc1–1 (upper panel) or PCNA3 (lower panel), the latter serving as a loading control.
Fig. 2
Fig. 2. Identification and characterization of UBP.
a SDS PAGE analysis of eluate from DNA affinity columns with ucm-containing oligonucleotides (ucm) or oligonucleotides with the same overall base composition but scrambled sequence (scr). Protein identity was confirmed by mass spectrometry by the Sir William Dunn School of Pathology mass spectrometry facility. Note that UBP migrates anomalously slowly on SDS PAGE, presumably a consequence of its basic pI. b Electrophoretic mobility shift assays (EMSAs) with the indicated concentrations of purified recombinant UBP and with 50 bp double-stranded DNA oligonucleotides containing ucm (ucm) or scrambled (scr) sequence. c EMSAs with zero, 74, 370, or 740 nM UBP and 20 bp double-stranded ucm-containing oligonucleotides or either top or lower single-stranded oligonucleotides. d EMSAs with 50 bp double-stranded oligonucleotides with either WT origin sequences or sequences corresponding to the M6, M7, M6, and M7 (M67) or M8 sequence substitutions and the indicated amount of UBP. Quantification of unbound DNA from the experiment shown in the upper panel of d, along with two further replicates. Bars indicate the average of the three replicates. Individual data points are shown for each replicate (black circles), and the error bar is the standard deviation from the average of the three triplicates. Values for unbound DNA at 74 nM, 370 nM, and 740 nM UBP are shown in blue, orange, and green, respectively. e SDS-PAGE of the results of incubating 40 bp double-stranded annealed oligonucleotides with predicted Tm of 50.4 °C with increasing concentrations of UBP (0, 74, 370, or 740 nM) prior to incubation at 55, 60, or 65 °C and electrophoresis in the presence of SDS. Reactions that were boiled (Boil) or maintained at room temperature (RT) are included as controls for single-stranded (ss) or double-stranded (ds) DNA migration. f DNase I footprinting of increasing concentrations of UBP on 50 base-pair double-stranded DNA oligonucleotides containing the ucm site [top strand labeled (left panel) and bottom strand labeled (right panel), see sequence under gel images]. The size ladder on the right of the gel was generated by labeling a mix of synthetic oligonucleotides corresponding to sequential 10 nt 3’ truncations of the substrates’ labeled strands. The region of protection is summarized under the gel images. g. DNAse I footprinting on 181 bp oriC1 sequences in the presence of Orc1–1 and UBP individually or in combination. A Maxam-Gilbert A + G sequencing ladder of the DNA substrate is shown in the left lane. Positions of ORB3, the ucm and ORB2 are indicated.
Fig. 3
Fig. 3. Structural studies of free and DNA-bound UBP.
a X-ray crystal structure of the DNA-free UBP homodimer. One protomer in shown in purple, the other in teal. b Adaptive Poisson–Boltzmann solver electrostatic surface plot generated by Pymol v3.0.3 (Schrodinger, LLC) for the UBP homodimer. c Close-up of the C-terminal strand swap interface of the UBP homodimer, showing the electron density map as a mesh. d X-ray crystal structure of UBP bound to duplex oligonucleotides corresponding to the ucm sequence. The DNA-binding beta-hairpins are highlighted in lilac. e Contacts between UBP and DNA, figure generated using DNAproDB. f Comparison from the same viewpoint of UBP in DNA-free and DNA-bound states. A single protomer is in teal with the C-terminal region of the protein that undergoes strand-swap in the absence of DNA highlighted in purple.
Fig. 4
Fig. 4. UBP interacts with the N-terminal domains of MCM.
a Yeast two-hybrid (Y2H) analysis of interactions between UBP, Orc1–1 and MCM, fused to either DNA binding domain or transcriptional activation domain. Growth on His plates is indicative of interaction. b Diagram of the domain organization of MCM (upper panel) and the X-ray crystal structure with the A, B/C and AAA+ domains colored as in the above diagram. The C-terminal wH domain is not present in the crystal structure. The figure was generated from PDB file 3F97 using Pymol v3.0.3 (Schrodinger, LLC). c Y2H assays between UBP and the constituent N-terminal (NT, residues 1–266), AAA+ (residues 267–601) and C-terminal winged-helix (wH, residues 602–686). d Y2H assays with sub-domains of MCM’s N-terminal domains—A (1–106) and B/C (107–266). e GST pull-down assays with GST alone, GST fused to MCM 1–266 (GST-MCM-NT), MCM 1–106 (GST-A) or MCM 107-266 (GST-B/C). The upper panel shows reactions run on a gel and stained with Coomassie, the lower panel is the result of western blotting of these samples, detected with anti-UBP antisera. f EMSAs with 140 bp ucm-containing oligonucleotides derived from oriC1. Reactions were incubated in the presence or absence of 370 nM UBP before the addition of increasing concentrations of MCM prior to electrophoresis on a native gel. The positions of free DNA, UBP-DNA complex and DNA-MCM or DNA-UBP-MCM complex is indicated. g EMSAs with 140 bp ucm-containing oligonucleotides derived from oriC1. Reactions were incubated in the presence or absence of 370 nM UBP before the addition of increasing concentrations of MCM’s N-terminal domain (aa 1–266, MCM–NT) prior to electrophoresis on a native gel. The positions of free DNA, UBP–DNA complex and DNA–MCM–NT, or DNA–UBP–MCM–NT complex, are indicated.
Fig. 5
Fig. 5. UBP expression, binding profile and the role of the ucm in vivo.
a Western blot (upper panel) of a titration series of purified recombinant UBP (lanes 1–5) and whole cell extract from known numbers of cells (lanes 6–9). The lower panel indicates a graph of signal intensity versus UBP quantity with a linear curve fit applied. The blue line indicates a signal intensity for UBP in extract from 1.7 × 107 cells, which is clearly in the linear range, and an extrapolation to the x-axis to reveal the corresponding amount of UBP. b Growth, stationary and death phases of a S. islandicus culture monitored by OD6000 nm. Western blotting of whole cell extracts at the indicated timepoints with antisera to UBP and, as a loading control, the general transcription factor, TBP. c Upper panel: chromatin precipitation experiments with anti-sera against UBP and MCM in the wild-type and M7-mutation-containing strain. qPCR was performed with primer pairs specific for oriC1 and oriC3, the bar graphs indicate the mean of three independent experiments with the values of recovery of input-normalized oriC1 DNA divided by that of input-normalized oriC3 DNA. Individual data points are shown as diamonds. ChIP results from the wild-type strain are shown in white, from M7 in pale blue. The lower panel shows ChIP experiments using anti-Orc1–1 antisera in the WT, M7 and M12 strains, Values are normalized to input DNA, as above; the bars represent the mean of three independent experiments, with individual data points shown as diamonds. d A genome-wide profile of UBP binding assayed by ChIP-Seq for wild-type and M7 mutant strains, the positions of the three replication origins are indicated in red. e Enlarged view of the oriC1-containing region of the chromosome for the data shown in panel (d). f Aggregated analysis of the relative abundance of UBP ChIP signal in regions up to 200 bp upstream of open-reading frames (ORFs), across the ORFs themselves and in the downstream 200 bp. g A consensus sequence was identified using the MEME suite using a sequence library of the top 100 ranked UBP sites identified by the MACs peak caller.
Fig. 6
Fig. 6. Phenotypic consequences of UBP overexpression.
a Growth curves of Sulfolobus islandicus cells containing either a UBP-over-expression plasmid (diamond and triangle) or the empty vector control (circles) grown in the presence of arabinose. Duplicate cultures are indicated by red and black and the absorbance at 600 nm is plotted. Time points sampled for the subsequent experiments are highlighted (30, 45 and 55 h). b Flow cytometry profiles of cells containing either a UBP-over-expression plasmid (UBP-OE) or the empty vector control (vector) grown in the presence of arabinose/see also Supplementary Fig. 6. c Pearson correlation matrix of gene expression profiles of the stains (empty vector—“Vec” or UBP-over-expressing “UBP”) at the indicated time points (30, 45, and 55 h after arabinose addition). Figure generated using SeqMonk (Babraham Institute, UK). d Neighbor joining tree derived from the Pearson correlation distance matrix in panel (c). Figure generated using SeqMonk (Babraham Institute, UK). e Heat map of expression profiles of the 793 coding sequences that were identified by DESeq2 as altering significantly (p < 0.05) in the dataset. Plot was generated using the hierarchical profile option in SeqMonk (Babraham Institute, UK). DESeq2 was performed with a two-sided test with multiple testing correction applied.
Fig. 7
Fig. 7. Model for UBP function at oriC1.
a In vitro loading assays using purified recombinant Orc1–1 (E147A), MCM and UBP as indicated. b Speculative model for the role of UBP and the ucm at oriC1.

Similar articles

References

    1. Jacob, F., Brenner, S. & Cuzin, F. On the regulation of DNA replication in bacteria. Cold Spring Harb. Symp. Quant. Biol.28, 329–348 (1963).
    1. Skarstad, K. & Katayama, T. Regulating DNA replication in bacteria. Cold Spring Harb. Perspect. Biol.5, a012922 (2013). - PMC - PubMed
    1. Bell, S. P. & Dutta, A. DNA replication in eukaryotic cells. Annu. Rev. Biochem71, 333–374 (2002). - PubMed
    1. Lee, C. S. K., Weibeta, M. & Hamperl, S. Where and when to start: regulating DNA replication origin activity in eukaryotic genomes. Nucleus14, 2229642 (2023). - PMC - PubMed
    1. Nakatani, T. et al. Emergence of replication timing during early mammalian development. Nature625, 401–409 (2024). - PMC - PubMed

MeSH terms

LinkOut - more resources