. 2025 Jun 5;16(1):5246.
doi: 10.1038/s41467-025-60570-2.

Bacterial membrane nanovesicles encapsulating prodrug assemblies combine chemical and immunological therapies for chronic bacterial infection

Affiliations

Bacterial membrane nanovesicles encapsulating prodrug assemblies combine chemical and immunological therapies for chronic bacterial infection

Yuanfeng Li et al. Nat Commun. .

Abstract

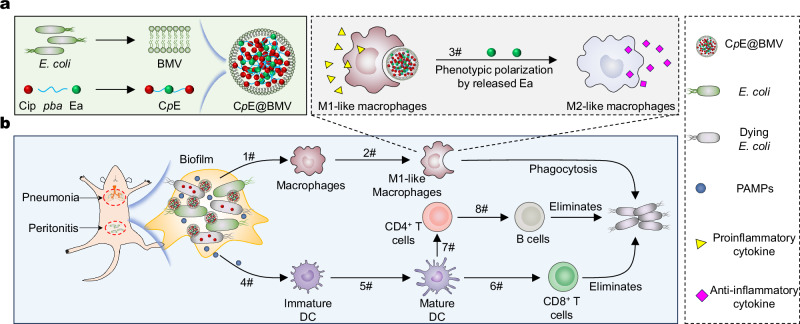
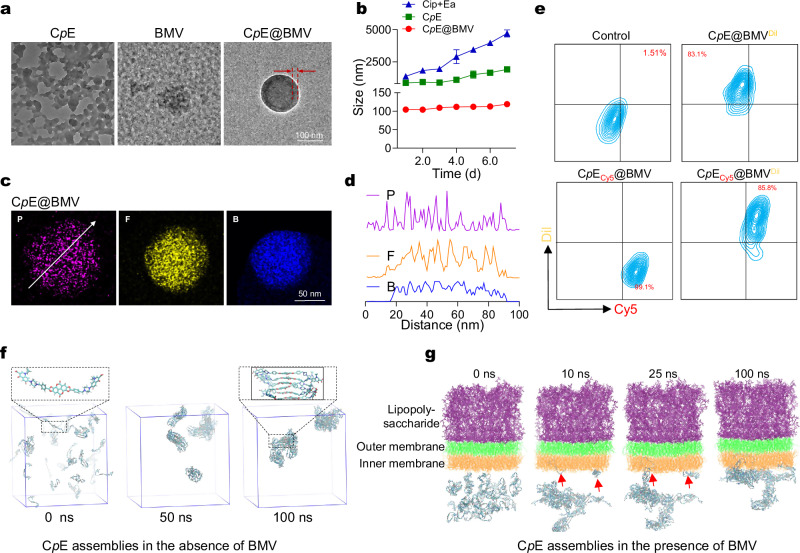
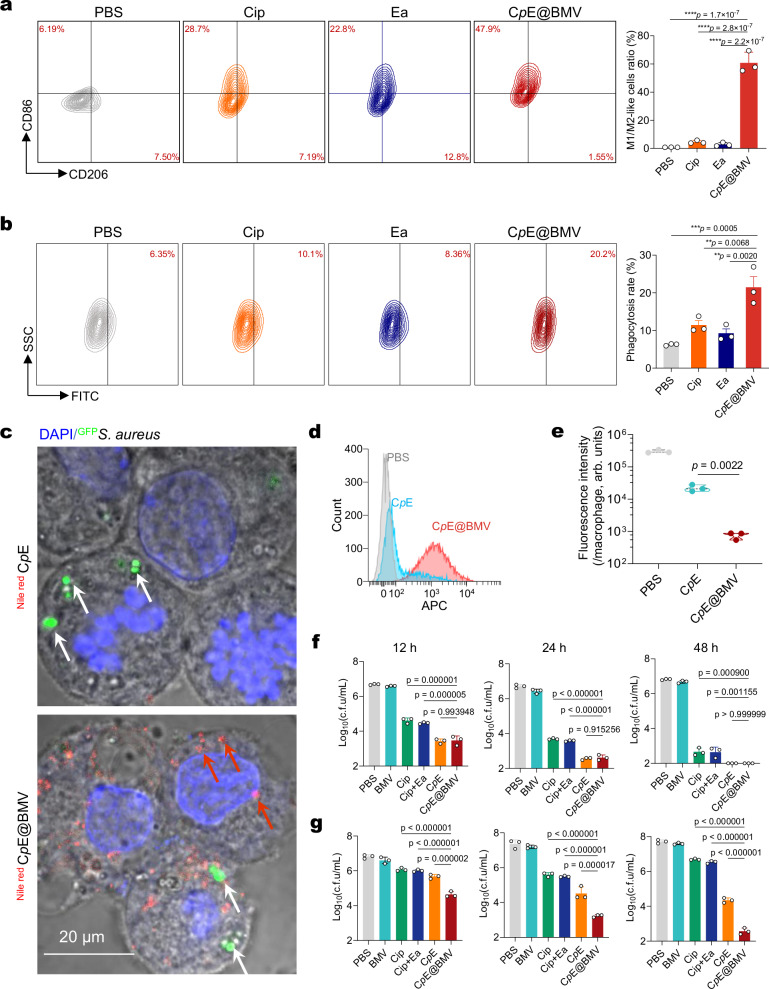
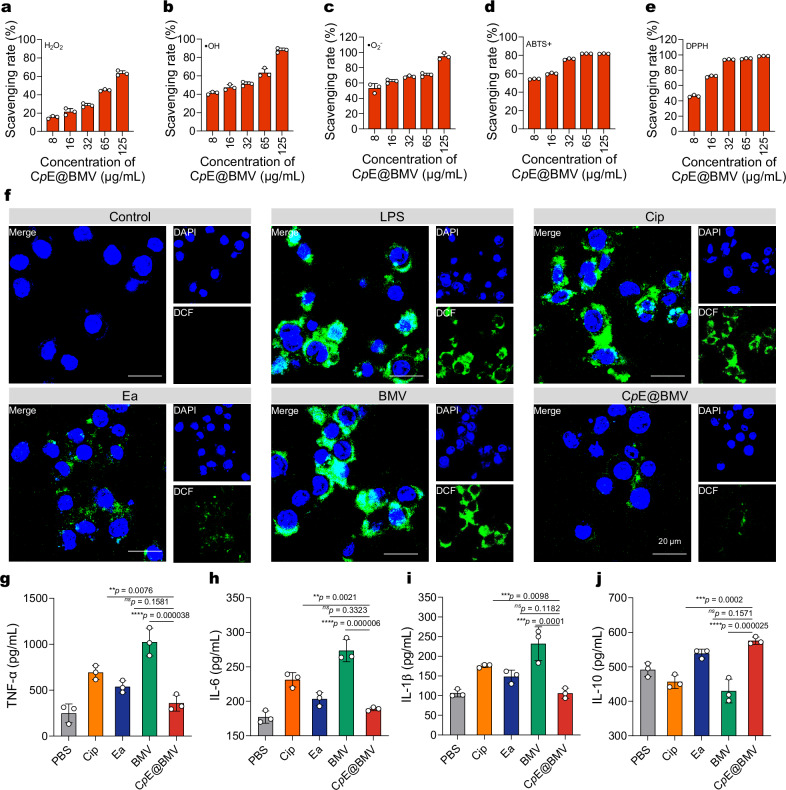
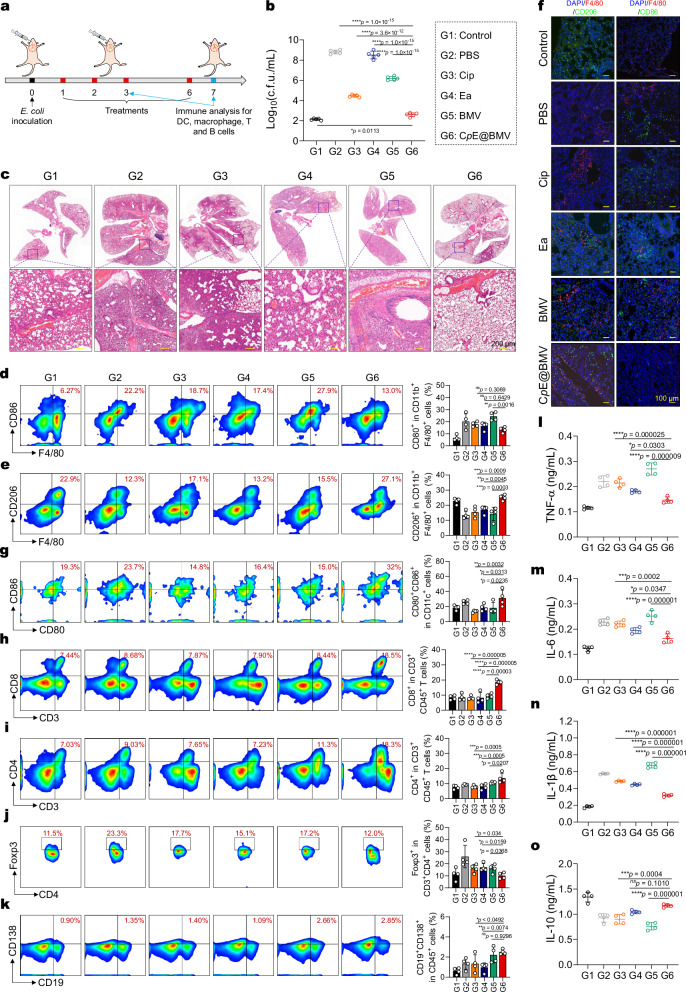
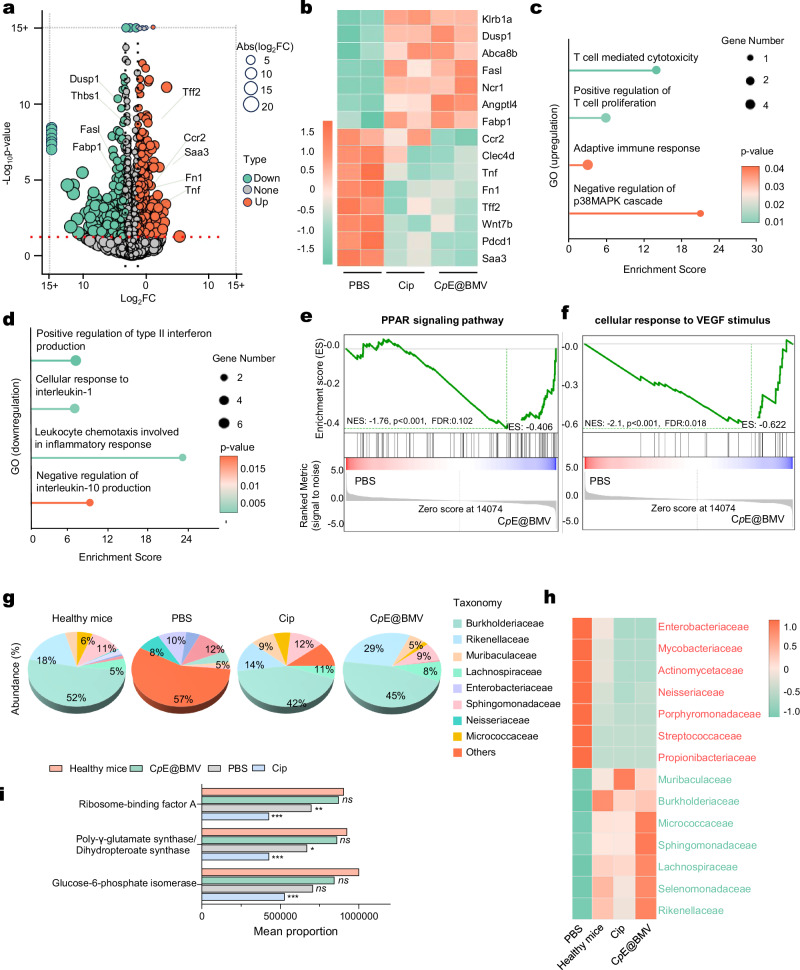
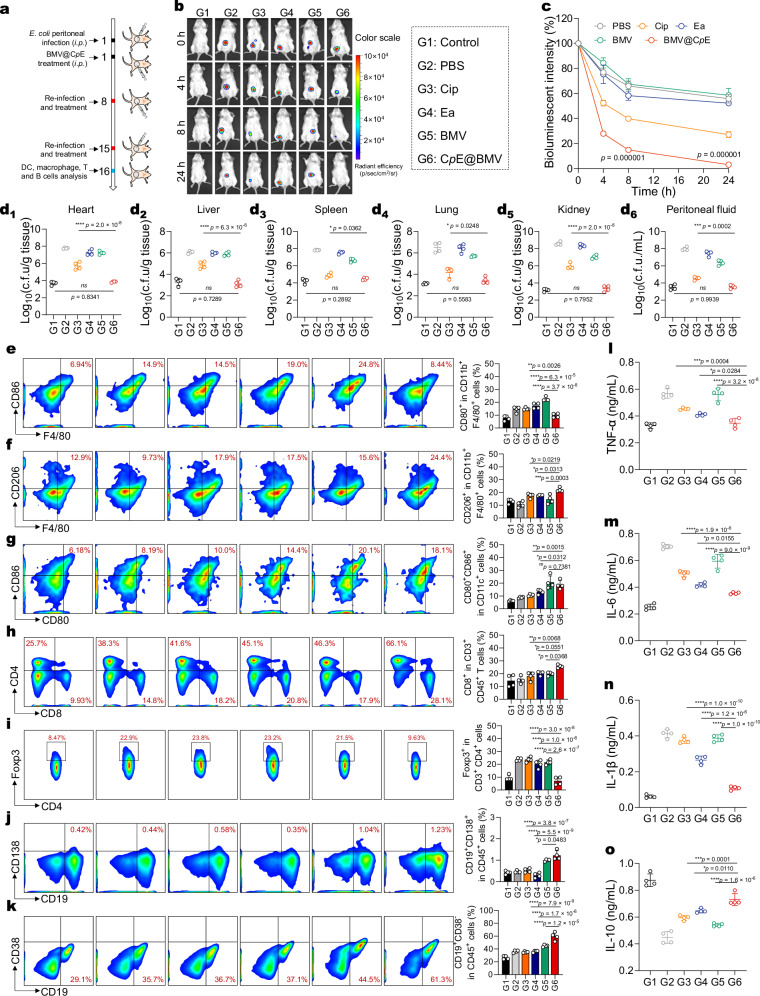
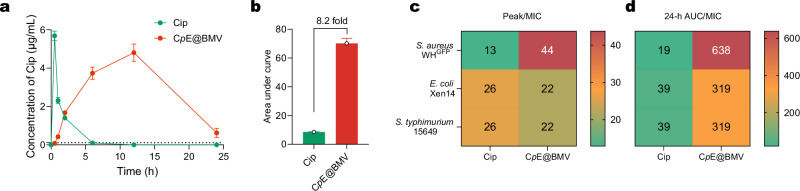
Overcoming challenges in drug targeting and modulating the immunosuppressive microenvironment are critical for treating chronic bacterial infections, which are often characterized by intracellular bacteria and biofilms. To overcome these barriers, we report a multifunctional nanomedicine (CpE@BMV). The prodrug conjugate (CpE), composed of two phenylboronic acid-modified ciprofloxacin (Cip-pba) molecules and ellagic acid (Ea), self-assembles due to its hydrophobic nature and π-π stacking. Bacterial membrane vesicles (BMVs) derived from Escherichia coli aid in CpE assembly and structural stabilization. Upon administration, pathogen-associated molecular patterns on CpE@BMV engage toll-like receptors on macrophages, activating these cells and enhancing their phagocytic response. Once internalized, CpE responds to elevated intracellular H₂O₂ levels, releasing Cip to eliminate intracellular bacteria. Additionally, Ea scavenges excess reactive oxygen species in inflamed macrophages and modulates the expression of inflammatory factors, preventing an exaggerated inflammatory response. The CpE@BMV formulation also penetrates biofilms, eliminating bacteria and releasing antigens. These antigens are transported to draining lymph nodes, where they induce dendritic cell maturation and trigger a robust T and B cell-mediated immune response, helping restore immune balance and combat pathogens effectively in female mouse models. Therefore, our CpE@BMV provide an efficient strategy combining chemical and immunological therapies for chronic bacterial infection management.


Conflict of interest statement

Competing interests: The authors declare no competing interests.

Figures

Fig. 1
Fig. 1. Schematic diagram illustrating the preparation of CpE@BMV and the proposed mechanism of action to enhance antimicrobial immune response.
a Preparation of CpE@BMV via BMV cloaked prodrug CpE. BMV was extracted from E. coli. Prodrug CpE was synthesized using Cip and Ea with a pba linker. b CpE@BMV facilitated bacterial killing and immune regulator. 1#: E. coli was killed by CpE@BMV, resulting in the release of PAMPs that combined with BMV to induce macrophage polarization; 2#: M0 macrophage polarized into M1-like macrophage for efficient phagocytosis of E. coli; 3#: uptakes of CpE@BMV nanoparticles led to Ea release, further reprogramming M1-like to M2-like macrophage; 4#: generated PAMPs was delivered into immature DC; 5#: promoted DC maturation; 6#: naïve T cells were activated and differentiated into specific CD8+ T cells for eliminated E.coli; 7#: activated naïve T cells differentiated into CD4+ T cells; 8#: B cells was activated by CD4+ T cells and contributed to the elimination of E. coli.
Fig. 2
Fig. 2. Characterization of CpE@BMV.
a Representative TEM images of CpE, BMV, and CpE@BMV. Scale bar: 100 nm. For CpE@BMV, the thickness of the BMV film in CpE@BMV was around 20 nm. b Colloidal diameter of Cip+Ea, CpE, and CpE@BMV in phosphate buffer (PB, pH 7.4, 10 mM) over a 7-day period was measured using DLS. The CpE and CpE@BMV were diluted to a final concentration of 0.1 mg/mL for size measurement. Data are presented as mean ± s.d. (n = 3 biologically independent samples). c Elemental mapping image of CpE@BMV showing the distribution of P, F, and B elements. d Gray value distribution along the arrow in (c) for P, F, and B elements in CpE@BMV. e Representative nano-flow cytometry analysis of CpE@BMV. BMV and prodrug CpE core were labeled with Dil (yellow) and Cy5 (red), respectively. f Snapshots from the all-atom simulations illustrate the assembly process of CpE without BMV at different time points, with an enlargement showing the planar structure of Ea and the stacking of Ea driving aggregate formation. g Snapshots from the all-atom simulations depict the assembly process of CpE in the presence of BMV at different time points. The insertion of CpE into the bacterial membrane is indicated by the red arrows. The upper leaflet, middle leaflet, and lower leaflet of the bacterial outer membrane vesicles are represented in purple, green, and orange, respectively.
Fig. 3
Fig. 3. CpE@BMV infiltrated macrophages and stimulated them for intracellular bacterial eradication.
a Flow cytometry analysis illustrating the changes in CD86 (M1 marker) and CD206 (M2 marker) expression in RAW264.7 macrophages following different treatments and statistical analysis of the ratio of M1/M2 macrophages, equivalent to CD86-positive/CD206-positive cells. b Representative flow cytometry image and quantitative analysis of the phagocytosis of S. aureus WHGFP by RAW264.7 macrophages treated as specified. c Representative CLSM image depicting RAW264.7 cells with intracellular S. aureus WHGFP (white arrow) post-treatment with Nile Red-labeled CpE and CpE@BMV (red arrow). Each experiment was repeated three times independently with similar results. d Flow cytometry analysis of fluorescence intensity in the infected RAW264.7 macrophages after co-incubation with Nile Red-labeled CpE and CpE@BMV for 2 h. e Quantitative analysis of green fluorescence intensity of S. aureus WHGFP (live bacteria) within macrophages following treatment with PBS, CpE, and CpE@BMV. f, g Statistical analysis of the c.f.u. of extracellular (f) and intracellular (g) surviving S. aureus WHGFP in cocultures of bacteria and RAW264.7 macrophages after exposure to different treatments for 12, 24, and 48 h. Data are mean ± s.d. of n = 3 biologically independent samples. Statistical significance was determined by one-way ANOVA with Tukey’s multiple comparisons test, p > 0.05, no significance (ns), *p < 0.05; **p < 0.01; ***p < 0.001; and ****p < 0.0001. Source data are provided as a Source Data file.
Fig. 4
Fig. 4. CpE@BMV scavenges the excessive ROS of LPS-induced macrophages.
ae ROS scavenging efficiency of CpE@BMV toward H2O2 (a), •OH (b), •O2 (c), ABTS+ (d), and DPPH (e) at different nanoparticles concentrations (n = 3 independent samples). f Fluorescence images of intracellular ROS in LPS-treated RAW264.7 cells after various treatments. RAW264.7 cells were stained with a DCFH-DA fluorescence probe. Scale bar: 20 μm. gj The levels of TNF-α (g), IL-6 (h), IL-1β (i), and IL-10 (j) in the supernatant of RAW264.7 macrophages after different treatments for 24 h were examined using ELISAs. Data are presented as means ± s.d. (n = 3 biologically independent samples). Statistical significance was determined using one-way ANOVA with Tukey’s post hoc test, p > 0.05, no significance (ns), *p < 0.05; **p < 0.01; ***p < 0.001; and ****p < 0.0001.
Fig. 5
Fig. 5. CpE@BMV effectively suppresses E. coli pulmonary infection in vivo.
a Experimental scheme of the E. coli-induced pulmonary infection model in female BALB/c mice. Different formulations administered via tracheal needle on days 1, 2, 3, and 6 using equivalent doses of Cip, Ea, and BMV were 1.76 mg/kg, 0.76 mg/kg, and 1.12 mg/kg, respectively (n = 4 biologically independent mice). b Quantified c.f.u. of E. coli in excised lung tissues from treatment endpoints was performed (n = 4 biologically independent mice). c Representative H&E staining images of the collected lung tissues from different groups after various treatments on day 7. Each experiment was repeated three times independently with similar results. d, e Representative scatter plots of flow cytometry data and quantitative results demonstrated the percentage of M1-phenotype macrophages (d) and M2-phenotype macrophages (e) within the CD11b+F4/80+ cell population in the lung tissues on day 7 after various treatments (n = 4 biologically independent mice). f Representative immunofluorescent images were captured for lung tissues. Each experiment was repeated three times independently with similar results. gk Representative scatter plots of flow cytometry data and quantitative results showing the number of mature DCs (CD80+CD86+) (g), CD8+ T cells (CD3+CD8+) (h), CD4+ T cells (CD3+CD4+) (i), regulatory T cells (CD3+CD4+Foxp3+) (j), plasmablasts (CD138+CD19+) and plasma cells (CD138+CD19) (k) (n = 4 biologically independent mice). lo Cytokine concentrations of TNF-α (l), IL-6 (m), IL-1β (n), and IL-10 (o) in the infected lung tissue from the mice that received various treatments as measured by ELISA (n = 4 biologically independent mice). Data are presented as means ± s.d. Statistical significance was determined using one-way ANOVA with Tukey’s post hoc test, p > 0.05, no significance (ns), *p < 0.05; **p < 0.01; ***p < 0.001; and ****p < 0.0001.
Fig. 6
Fig. 6. Transcriptome sequencing and microbiota analysis in the pulmonary model on day 7 post various treatments.
a Volcano plot displayed the distributions of upregulated and downregulated genes (≥2-fold difference, p-value < 0.05) in the CpE@BMV group compared to the PBS group. None, non-differentially expressed genes (DEGs). b Heatmaps of different groups of upregulated and downregulated DEGs related to immune response pathways. c, d Gene ontology (GO) enrichment analysis of DEGs performed for both upregulated (c) and downregulated (d) GO terms between the CpE@BMV-treated mice and PBS-treated mice. e, f Gene set enrichment analysis (GSEA) of DEGs enriched in PPAR signaling pathway (e) and cellular response to VEGF stimulus (f). g Relative abundance of the top 7 family-level taxa in the lung microbiome across healthy mice, PBS, Cip, and CpE@BMV treatments. h Relative abundance of various taxa in the healthy mice, PBS, Cip, and CpE@BMV treatments. Red, pathogenic strains in lung infection. Green, non-pathogenic strains. i Predicted functional compositions of the microbial communities in the healthy mice, PBS, Cip, and CpE@BMV treatments. Data are presented as means ± s.d. Statistical significance was determined using one-way ANOVA with Tukey’s post hoc test, p > 0.05, no significance (ns), *p < 0.05; **p < 0.01; ***p < 0.001; and ****p < 0.0001.
Fig. 7
Fig. 7. CpE@BMV exhibits bacterial eradication activity in the peritonitis model and established immunological memory in vivo.
a Experimental scheme of the E. coli peritonitis model in female BALB/c mice. Different formulations administered via i.p. on day 1 using equivalent doses of Cip, Ea, and BMV were 1.76 mg/kg, 0.76 mg/kg, and 1.12 mg/kg, respectively (n = 4 biologically independent mice). b Bioluminescent images of the mice with peritonitis model after various treatments. c Quantified bioluminescence intensity from the images in (b) (n = 4 biologically independent mice). d1d6 Quantitative analysis of survival E. coli in d1 heart, d2 liver, d3 spleen, d4 lung, d5 kidney, and d6 ascites fluid of the mice receiving various treatments on day 2 (n = 4 biologically independent mice). ek Representative scatter plots of flow cytometry data and quantitative results showing the number of M1-phenotype macrophages (F4/80+CD80+) (e), M2-phenotype macrophages (F4/80+CD206+) (f), mature DCs (CD80+CD86+) (g), CD8+ and CD4+ T cells (h), regulatory T cells (CD3+CD4+Foxp3+) (i), plasmablasts (CD138+CD19+) (j), and memory B cells (CD19+CD38) (k) (n = 4 biologically independent mice). lo Cytokine concentrations of TNF-α (l), IL-6 (m), IL-1β (n), and IL-10 (o) in the peritoneal fluid from the mice that received various treatments as measured by ELISA (n = 4 biologically independent mice). Data are presented as means ± s.d. Statistical significance was determined using one-way ANOVA with Tukey’s post hoc test, p > 0.05, no significance (ns), *p < 0.05; **p < 0.01; ***p < 0.001; and ****p < 0.0001.
Fig. 8
Fig. 8. CpE@BMV enhances the pharmacokinetic profile of Cip.
a Cip concentration in plasma following peritoneal infection with either Cip or CpE@BMV at different time intervals. Data are presented as mean ± S.D. (n = 3 biological replicates). b Area under the curve calculated from (a). c Heatmap showing the Peak/MIC ratio of Cip and CpE@BMV against the various pathogens. d Heatmap showing the 24-h AUC/MIC ratio of Cip and CpE@BMV against the various pathogens.

Similar articles

References

    1. Young, D., Hussell, T. & Dougan, G. Chronic bacterial infections: living with unwanted guests. Nat. Immunol.3, 1026–1032 (2002). - PubMed
    1. Hou, X. et al. Vitamin lipid nanoparticles enable adoptive macrophage transfer for the treatment of multidrug-resistant bacterial sepsis. Nat. Nanotechnol.15, 41–46 (2020). - PMC - PubMed
    1. Zhao, X. et al. Guiding antibiotics towards their target using bacteriophage proteins. Nat. Commun.15, 5287 (2024). - PMC - PubMed
    1. Zhu, J. et al. Multimodal nanoimmunotherapy engages neutrophils to eliminate Staphylococcus aureus infections. Nat. Nanotechnol. 19, 1032–1043 (2024). - PMC - PubMed
    1. Wolcott, R. D. & Ehrlich, G. D. Biofilms and chronic infections. JAMA299, 2682–2684 (2008). - PubMed

MeSH terms