. 2025 Jun 5;15(1):19328.
doi: 10.1038/s41598-025-00995-3.

Multimodal assessment of sleep-wake perception in insomnia disorder

Affiliations

Multimodal assessment of sleep-wake perception in insomnia disorder

Carlotta L Schneider et al. Sci Rep. .

Abstract

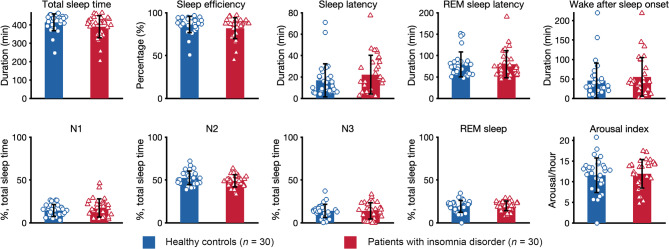
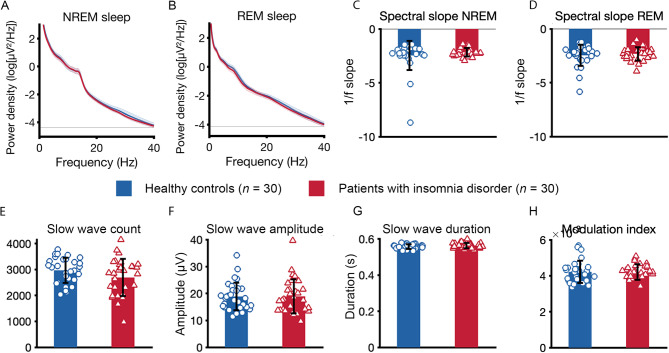
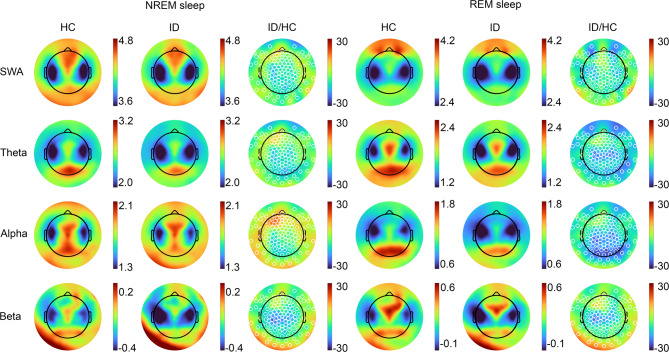
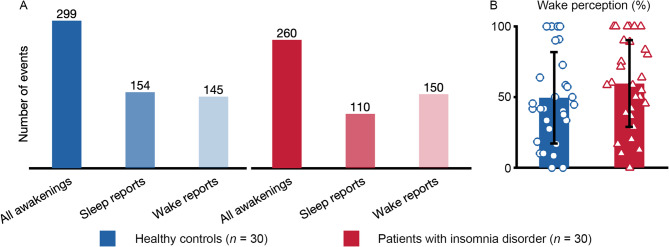
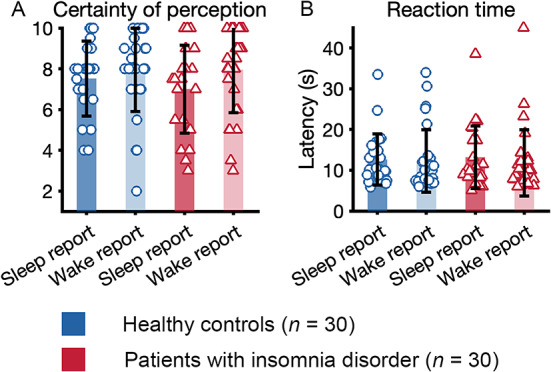
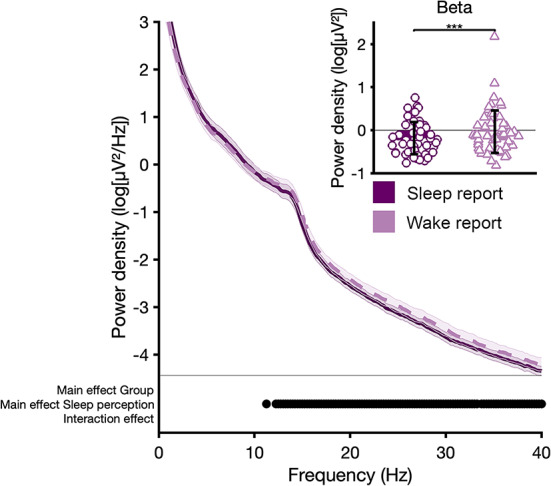
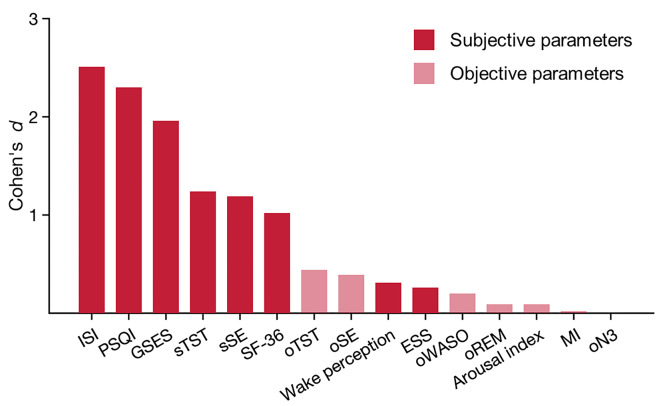
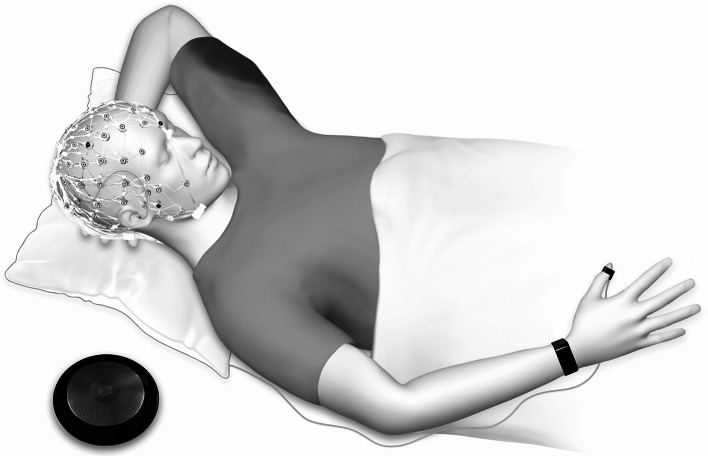
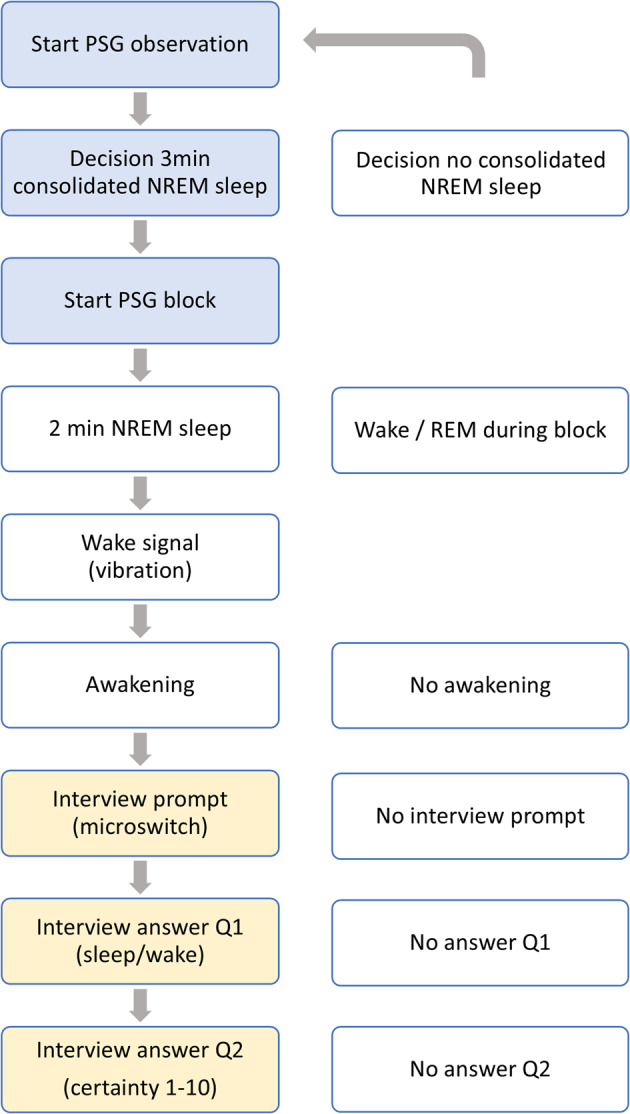
Insomnia disorder is a prevalent health problem. The primary diagnostic criterion is a subjective complaint about reduced quantity or quality of sleep, which is often not observed in objective sleep measurements. Here we show that patients with insomnia disorder, characterized by substantial subjective sleep complaints, did not differ on objective measures of sleep continuity, sleep architecture, spectral power, spectral slope, and phase-amplitude coupling of slow oscillatory and spindle activity. Perception of wakefulness following serial awakenings from NREM sleep was frequent in both patients and controls, with no significant group difference. High frequency spectral power, as an index of cortical arousal prior to awakening, but not standard measures of sleep, predicted the perception of wakefulness across groups, possibly related to physiological wake-like activity during sleep. Our results support the notion that sleep-wake regulatory systems and direct sleep-wake perception are often intact in patients with insomnia disorder. These results propose empirical support for cognitive behavioral therapy for insomnia as the first-line treatment.

Keywords: Insomnia disorder; Polysomnography; Serial awakening; Sleep-wake perception; Spectral analysis.


Conflict of interest statement

Declarations. Competing interests: C.N. has served on advisory boards of Janssen, Idorsia and the GetOn Institute. All other authors declare no competing interests.

Figures

Fig. 1
Fig. 1
Sleep continuity and architecture. The figure depicts polysomnographic parameters of the baseline night for healthy controls and patients with insomnia disorder. T-test for independent samples did not reveal any group difference (all p > 0.05).
Fig. 2
Fig. 2
Sleep microstructure. The figure shows parameters of sleep microstructure of the baseline night for healthy controls and patients with insomnia disorder (calculated as an average across the scalp). (A) Log transformed power spectral density during NREM sleep (95% CI). (B). Log transformed power spectral density during REM sleep (95% CI). (C) Spectral slope NREM sleep. (D) Spectral slope REM sleep. (E) Slow wave count. (F) Slow wave amplitude. (G) Slow wave duration. (H) Modulation index during N2 and N3 sleep.
Fig. 3
Fig. 3
Spectral power densities across channels. The figure shows topographic distributions across derivations of spectral power density across frequency bands (log(µV), during NREM (columns 1–3) and REM sleep (columns 4–6), for healthy controls (HC) and patients with insomnia disorder (ID). Columns 3 and 6 (ID/HC) depict the differences in percentage between patients with insomnia disorder and healthy controls (percentages based on non-log transformed spectral power density values). SWA, slow wave activity. Channel-wise independent samples t-tests (FDR corrected across channels) on log transformed spectral power density did not reveal any group difference (all p > 0.05).
Fig. 4
Fig. 4
Sleep-wake perception. The figure visualizes results from a total of 559 serial awakening reports of healthy controls and patients with insomnia disorder. (A) A total of 299 awakenings in healthy controls with 154 sleep and 145 wake reports. A total of 260 awakenings in patients with insomnia with 110 sleep and 150 wake reports. (B) Percentage of wake reports after awakening from NREM sleep, for healthy controls (49.4 ± 32.3%) and patients with insomnia disorder (59.4 ± 30.7%). A t-test for independent samples did not reveal a significant group difference (p = 0.223; Cohen’s d = 0.32, small effect size).
Fig. 5
Fig. 5
Control parameters. (A) Certainty of sleep or wake perception across groups and perception. Certainty was assessed on a scale of 1–10, 10 being very certain. (B) Reaction time, measured from awakening signal (vibration bracelet) to indication of wakefulness (microswitch) across groups and perception.
Fig. 6
Fig. 6
Spectral power as an average across the scalp during the 2 min block of NREM sleep preceding awakening during experimental night (95% CI). Significant differences between wake or sleep reports (groups collapsed) are indicated in the bottom plot for each 0.5 Hz bin (2-way ANOVA; p < 0.05). Inset figure shows increased beta band power prior to wake compared to sleep reports (paired samples t-test; p < 0.05). Single data points are plotted according to a kernel density estimation to visualize distribution shape.
Fig. 7
Fig. 7
Effect sizes (ES) for group comparisons. Parameters refer to baseline, with the exception of wake perception that refers to the experimental night. Effect sizes are presented as positive values throughout, reflecting calculations in the direction of hypothesized effects. Insomnia severity index (ISI); Pittsburgh sleep quality index (PSQI); Glasgow sleep effort scale (GSES); Epworth sleepiness scale (ESS); Short form health survey, general health perception (SF-36); subjective total sleep time (sTST); subjective sleep efficacy (sSE); objective total sleep time (oTST); objective sleep efficacy (oSE); wake perception upon awakening during experimental nights; objective wake after sleep onset (oWASO); objective slow wave sleep (oN3); objective rapid eye movement sleep (oREM); arousal index; modulation index (MI). Parameters sorted by effect size. Differences are significant from ISI to sSE.
Fig. 8
Fig. 8
Illustration of a participant in the sleep laboratory setting. The setup included a high-density electroencephalogram (128 electrodes), a vibration bracelet (iBells) attached to the wrist serving as the awakening signal, a microswitch attached to thumb for initiation of interview questions, IP30 in-earphones (Diatec) for the transmission of interview questions, and an intercom for recording of the interview answers. The three-dimensional figure was created by the authors using the software MakeHuman 1.2.0, licensed under CC0 (https://static.makehumancommunity.org).
Fig. 9
Fig. 9
Flowchart of the awakening procedure and interview. The left side of the flowchart illustrates steps of a single awakening procedure from online NREM sleep detection to completion of the interview. This includes online detection of NREM sleep by a trained rater, countdown of 3 min of NREM sleep, the initiation of the awakening protocol starting with a set 2 min PSG block, an automatic wake signal via the vibration bracelet, awakening of the participant, interview prompt via microswitch by the participant, answer given to the first interview question (“Just now, were you asleep or awake?”), and an answer given to the second interview question (“How certain are you, from one to ten”), and completion of the interview. The right side of the flow-chart illustrates reasons for exclusion from primary analysis.

Similar articles

Cited by

References

    1. American Psychiatric Association. Diagnostic and Statistical Manual of Mental Disorders. Fifth Edition. American Psychiatric Association. (2013). 10.1176/appi.books.9780890425596
    1. American Academy of Sleep Medicine, ed. International Classification of Sleep Disorders 3. edn (American Acad. of Sleep Medicine, 2014).
    1. World Health Organization (WHO). International Classification of Diseases, Eleventh Revision (ICD-11), (2019).
    1. Riemann, D. et al. The European insomnia guideline: an update on the diagnosis and treatment of insomnia 2023. J. Sleep. Res.32 (6), e14035. 10.1111/jsr.14035 (2023). - PubMed
    1. Baglioni, C. et al. Insomnia as a predictor of depression: a meta-analytic evaluation of longitudinal epidemiological studies. J. Affect. Disord. 135 (1–3), 10–19. 10.1016/j.jad.2011.01.011 (2011). - PubMed