. 2025 Jun 5;15(1):19742.
doi: 10.1038/s41598-025-03111-7.

Assessing individual head and neck squamous cell carcinoma patient response to therapy through integration of functional and genomic data

Affiliations

Assessing individual head and neck squamous cell carcinoma patient response to therapy through integration of functional and genomic data

Daniel Bottomly et al. Sci Rep. .

Abstract

Even though head and neck squamous cell carcinoma (HNSCC) is the seventh most common cancer worldwide, there are only two PD-1 targeted immunotherapies (pembrolizumab and nivolumab) and one tumor intrinsic EGFR targeted therapy (cetuximab) that are FDA approved for treatment of HNSCC. Taking advantage of a high throughput inhibitor assay and computational tools originally showing success in leukemia, we designed and employed HNSCC-specific inhibitor panels that capture the diversity of aberrational pathways in HNSCC to test viable cells derived from patients' HNSCC tumors. This provides a functional context to the multi-omic readouts conducted on these samples (mutations, protein expression and copy number alterations). In addition to generating these deeply characterized functional genomics datasets, we also developed additional visual analytics that have the potential to provide greater insight into HNSCC drug response patterns and potentially aid precision oncology tumor boards in evaluation and assessment of effective targeted therapeutic agents.

Keywords: Antitumor drug screening assays; HNSCC; Multi-Omics.


Conflict of interest statement

Declarations. Competing interests: The authors declare no competing interests.

Figures

Fig. 1
Fig. 1
Weighted Gene Co-expression Analysis provides biological context to known HNSCC subtypes and correlates with clinical covariates in the HNSCC cohort. RNASeq from the HNSCC cohort tumor tissue samples were combined with TCGA and the four main subtypes were called for both cohorts. (a) A UMAP of expression data from the 643 genes used for determining subtypes is shown for TCGA with black dots indicating the HNSCC cohort samples. Samples that could not be confidently called (see “Methods”) are shown as transparent circles. (b) A heatmap of the median PC1 score (termed eigengene) in TCGA–HNSC is shown for each module (X-axis) and subtype (Y-axis) indicating the overall expression trend for genes in the module. (c) T-Statistics from specified comparisons (Y-axis) are shown for each module (X-axis). Stars indicate significance of the corresponding T-test where the unadjusted P-value < 0.001 is ***, < 0.01 **, < 0.05 * otherwise no significance. For the directionality of the tests not specified on the plot: One Year RFS–Yes vs. No, Smoker Pack Years–[0,15] vs. (59,100], Alcohol Use—Heavy vs. Minimal, Gender—Female vs. Male, Age–(40,62] vs. (62,90].
Fig. 2
Fig. 2
Summary of inhibitor pathway targeting. (a). A barplot indicating the number of targeted genes for each single-agent inhibitor used with the HNSCC cohort (X-axis) for each PanCancer pathway (Y-axis). (b) A barplot indicating the number of single-agent inhibitors used with the HNSCC cohort (Y-axis) for each candidate therapeutic targets for TCGA-HNSC. Colors correspond to the PanCancer pathways from (a). (c) Shown is a heatmap indicating the annotated co-targeting of the inhibitor combinations used in the HNSCC cohort. Text indicates the number of inhibitors with matching color intensity. (d). Paired t-test summary results for each drug combination (X-axis) grouped by single-agent PanCancer pathway (top). For each combination, the estimated difference (termed the log combination ratio; Y-axis) between the combination log AUC and the lowest single-agent log AUC is shown as a dot centered on a line representing the 95% confidence interval. Negative values indicate the combination is more sensitive than the corresponding single-agents. Stars indicate significance with P-value < 0.001 ***, < 0.01 **, < 0.05 * and N.S. indicating non-significance.
Fig. 3
Fig. 3
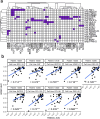
Drug response in the HNSCC cohort is consistent with large-scale cell line screens. Patient samples and GDSC cells lines were clustered according to alterations associated with drug response to one of the common inhibitors between the HNSCC cohort and GDSC. (a) Shown is a matrix plot where columns (samples or cell lines) and alterations (rows) are clustered based on their Jaccard distance. Purple indicates that the patient sample or cell line has the corresponding alteration. Only those patient samples (bold) or cell lines with at least one alteration are shown. Note that patient sample 10250 and 10356 have no matching cell lines based on their mutation profile. Pearson’s correlation was computed between the normalized AUC values for each patient sample and the AUCs of the matching inhibitors in GDSC. (b) Scatterplots of the AUC values for the matching drugs between the HNSCC cohort and GDSC are provided. Each scatterplot is faceted by patient sample id and the corresponding best GDSC cell line name (boxes on the top). The text indicates the Pearson’s correlation. Unadjusted significance is indicated by P-value: < 0.001 ***, < 0.01 ** < 0.05 *.
Fig. 4
Fig. 4
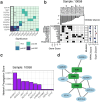
Prioritization of genes based on drug sensitivity. (a). Shown is a summary of the gene score significance for the HNSCC cohort patients relative to the TCGA candidate therapeutic target genes. The EGFR gene scored highly in three patients, two of whom had amplifications of the gene via copy number. The other patient, 10058, didn’t have copy number data. Patient 10058 had EGFR as the most significant gene target and was unlikely to have had an underlying amplification as it showed mild down-regulation of EGFR from both RPPA and expression. (b). Shown is the Response Card for patient 10058. Inhibitor data is shown on the top in the form of a Zscore with negative values indicating increased sensitivity. From left to right, the scores of the top genes by significance are shown along with SYK which was a target of the most significant drug. In addition, a heatmap displays the drug target data from Targetome. Finally, any mutations (black rectangle) in these genes are shown along with RPPA and expression from the tumor cell culture models after being centered/scaled to Zscore values. If available, copy number data is also displayed. (c) Using a network propagation approach we prioritized the patient’s somatic mutations and the results are displayed as a barplot where the resulting prioritization score is on the Y-axis and corresponding gene is on the X-axis. (d) The mutations that scored highly in the prioritization (blue ovals) were seen to interact with EGFR and the other significant gene targets (green rectangles) either directly or indirectly in a network context.

Similar articles

References

    1. Barsouk, A. et al. Risk factors, and prevention of head and neck squamous cell carcinoma. Med. Sci.11, 42 (2023). - PMC - PubMed
    1. Cancer of the Oral Cavity and Pharynx - Cancer Stat Facts.
    1. Wierzbicka, M., Pietruszewska, W., Maciejczyk, A. & Markowski, J. Trends in incidence and mortality of head and neck Cancer subsites among elderly patients: A Population-Based analysis. Cancers. 17. 10.3390/cancers17030548 (2025). - PMC - PubMed
    1. Miquel Dominguez, A. et al. Incidence, prevalence, and survival of head and neck cancers in the united Kingdom from 2000–2021. MedRxiv. 10.1101/2024.12.05.24318538 (2024).
    1. Alsahafi, E. et al. Clinical update on head and neck cancer: molecular biology and ongoing challenges. Cell. Death Dis.10, 540. 10.1038/s41419-019-1769-9 (2019). - PMC - PubMed

MeSH terms