

Correlation between ADGRV1 expression and clinical pathological and prognostic features in breast cancer
- PMID: 40473728
- PMCID: PMC12141595
- DOI: 10.1038/s41598-025-04695-w
Correlation between ADGRV1 expression and clinical pathological and prognostic features in breast cancer
Abstract
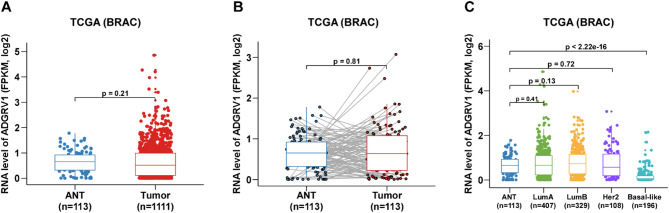
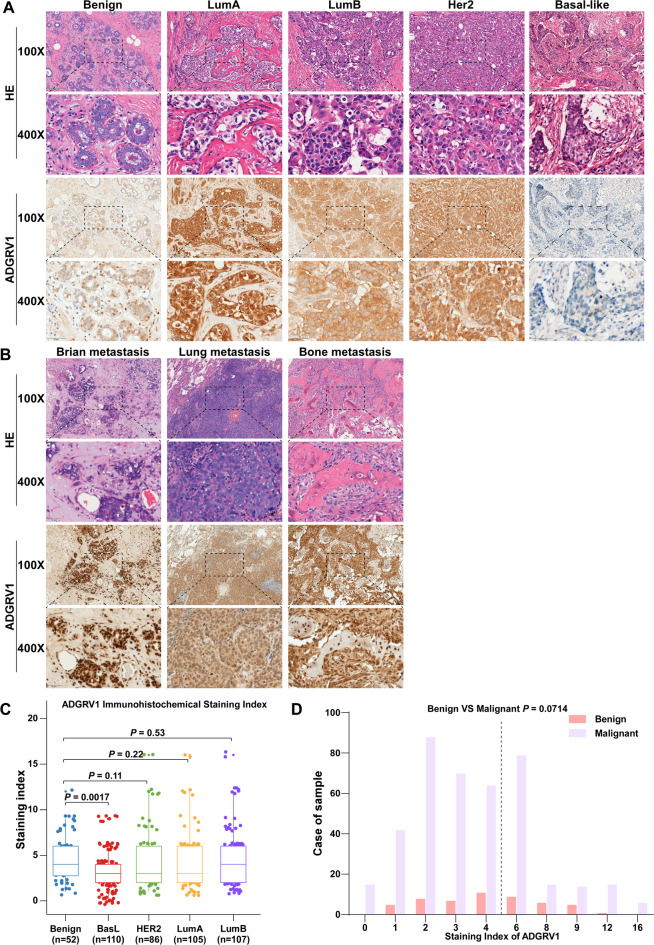
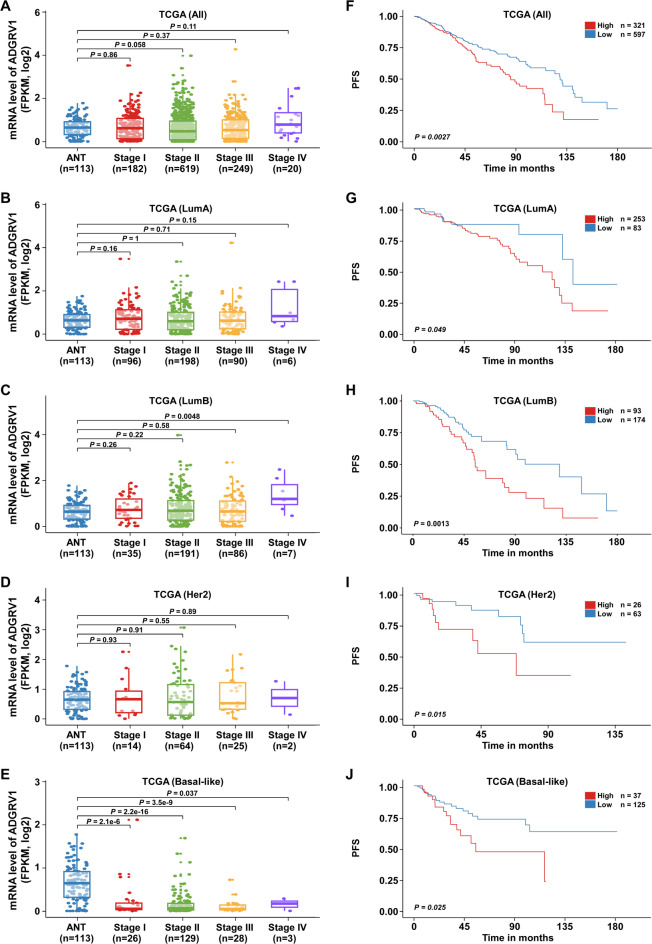
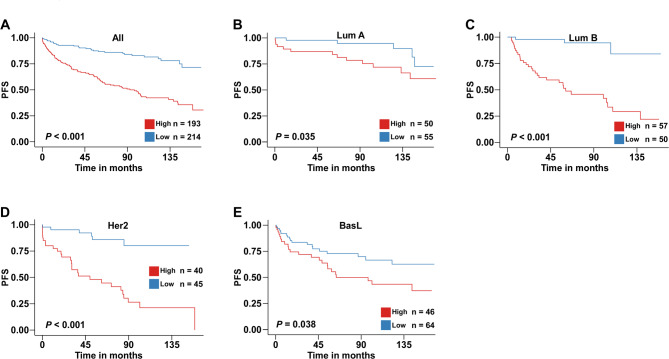
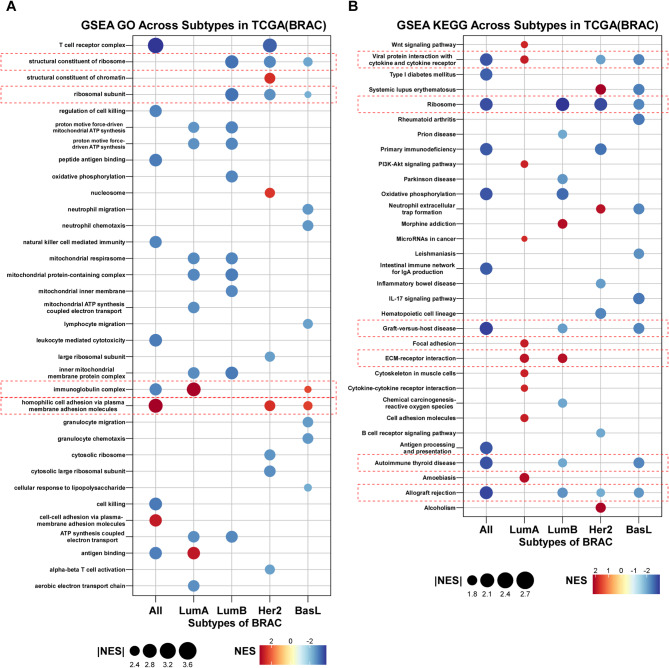
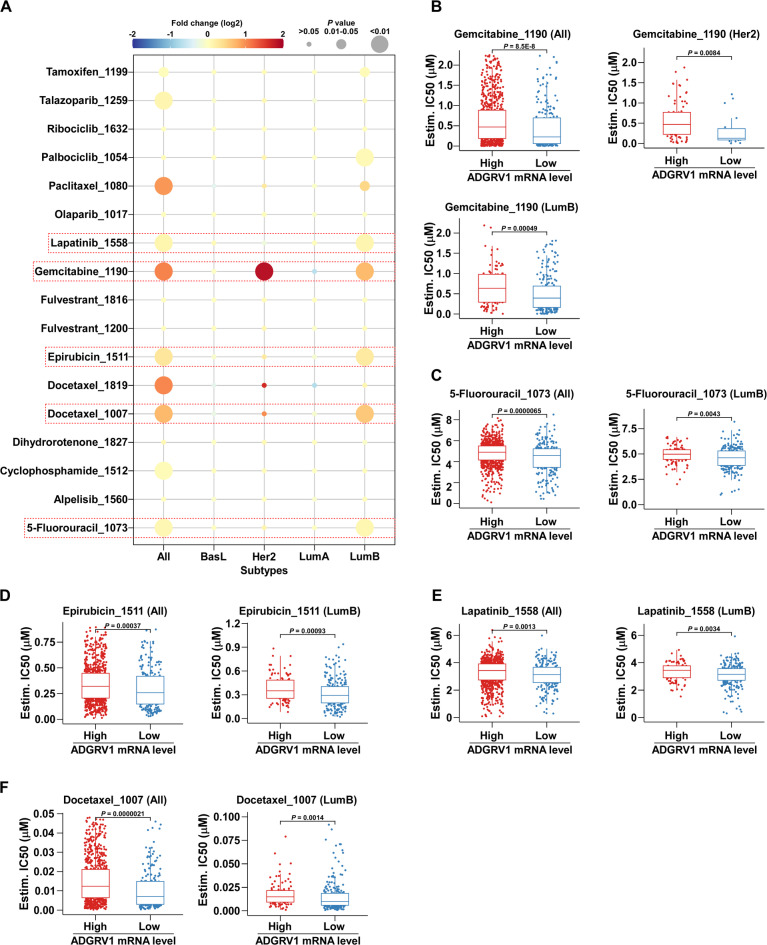
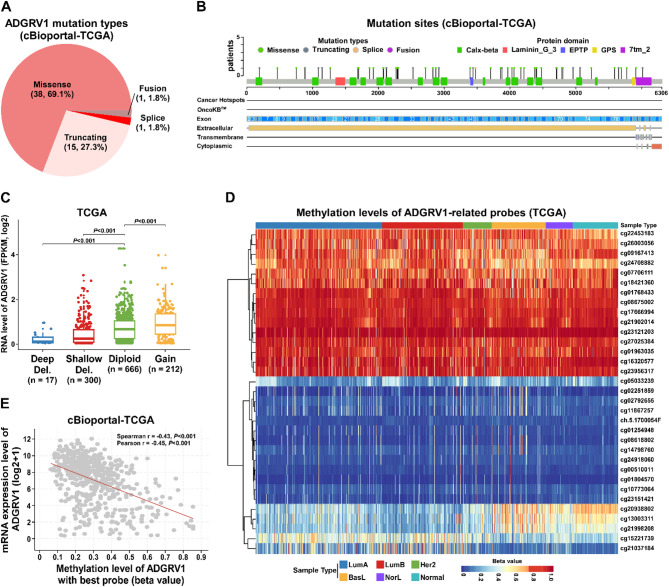
Breast cancer, a leading global health threat with rising incidence, demands precision medicine guided by molecular subtyping. ADGRV1, an adhesion G protein-coupled receptor gene implicated in tumorigenesis but unexplored in breast cancer, was investigated using TCGA data (1,231 cases) and a local cohort (408 cases). While ADGRV1 showed no differential expression between tumors and normal tissues (P = 0.210), it was significantly downregulated in basal-like subtypes (P < 0.001). The association between high ADGRV1 expression and poor prognosis remains significant in the overall cohort as well as within individual molecular subtype. Functional enrichment analyses linked ADGRV1 to ribosome suppression, ECM remodeling (positive ECM-receptor interaction), and immunosuppression (negative immune pathway regulation), suggesting its role in tumor metastasis. Drug sensitivity assays demonstrated ADGRV1-high tumors confer resistance to lapatinib, gemcitabine, and 5-fluorouracil, particularly in LumB subtypes. Mechanistically, copy number variations and promoter methylation (Pearson r =-0.45, P < 0.001) regulated ADGRV1 expression, with basal-like tumors showing hypermethylation-associated suppression. These findings position ADGRV1 as a prognostic biomarker and potential therapeutic target, highlighting its dual role in tumor microenvironment modulation and drug resistance.
Keywords: ADGRV1; Breast cancer; Drug sensitivity; Immune microenvironment; Methylation; Prognosis.
© 2025. The Author(s).
Conflict of interest statement
Competing interests: The authors declare no competing interests.
Figures
Similar articles
-
Prognostic and immune correlation of IDO1 promoter methylation in breast cancer.Sci Rep. 2024 Nov 13;14(1):27836. doi: 10.1038/s41598-024-79149-w. Sci Rep. 2024. PMID: 39537860 Free PMC article.
-
Bioinformatics identification of CCL8/21 as potential prognostic biomarkers in breast cancer microenvironment.Biosci Rep. 2020 Nov 27;40(11):BSR20202042. doi: 10.1042/BSR20202042. Biosci Rep. 2020. PMID: 33146700 Free PMC article.
-
ERα propelled aberrant global DNA hypermethylation by activating the DNMT1 gene to enhance anticancer drug resistance in human breast cancer cells.Oncotarget. 2016 Apr 12;7(15):20966-80. doi: 10.18632/oncotarget.8038. Oncotarget. 2016. PMID: 26980709 Free PMC article.
-
Aberrant DNA methylation impacts gene expression and prognosis in breast cancer subtypes.Int J Cancer. 2016 Jan 1;138(1):87-97. doi: 10.1002/ijc.29684. Epub 2015 Jul 30. Int J Cancer. 2016. PMID: 26174627 Review.
-
Emerging immune gene signatures as prognostic or predictive biomarkers in breast cancer.Arch Pharm Res. 2019 Nov;42(11):947-961. doi: 10.1007/s12272-019-01189-y. Epub 2019 Nov 9. Arch Pharm Res. 2019. PMID: 31707598 Review.
References
-
- Sung, H. et al. Global Cancer Statistics 2020: GLOBOCAN Estimates of Incidence and Mortality Worldwide for 36 Cancers in 185 Countries (2024). - PubMed
MeSH terms
Substances
Grants and funding
- 82103582/National Natural Science Foundation of China
- 82103582/National Natural Science Foundation of China
- 82103582/National Natural Science Foundation of China
- 82103582/National Natural Science Foundation of China
- 82103582/National Natural Science Foundation of China
- 82103582/National Natural Science Foundation of China
- 82103582/National Natural Science Foundation of China
- 2021A1515012432/Science and Technology Project of Guangdong Province
- 2021A1515012432/Science and Technology Project of Guangdong Province
- 2021A1515012432/Science and Technology Project of Guangdong Province
- 2021A1515012432/Science and Technology Project of Guangdong Province
- 2021A1515012432/Science and Technology Project of Guangdong Province
- 2021A1515012432/Science and Technology Project of Guangdong Province
- 2021A1515012432/Science and Technology Project of Guangdong Province
- J202001/Medical Science Foundation of Jiangmen Central Hospital
- J202001/Medical Science Foundation of Jiangmen Central Hospital
- J202001/Medical Science Foundation of Jiangmen Central Hospital
- J202001/Medical Science Foundation of Jiangmen Central Hospital
- J202001/Medical Science Foundation of Jiangmen Central Hospital
- J202001/Medical Science Foundation of Jiangmen Central Hospital
- J202001/Medical Science Foundation of Jiangmen Central Hospital
LinkOut - more resources
Full Text Sources
Medical
